
Sometimes things happen or do not happen differently than we expect it. That often requires a thorough investigation of the causality and flow of our code. The first move would normally be to throw a Debug.Log somewhere, where we expect our problem to happen. However, what if it is not enough?
Another parameter in Debug.Log
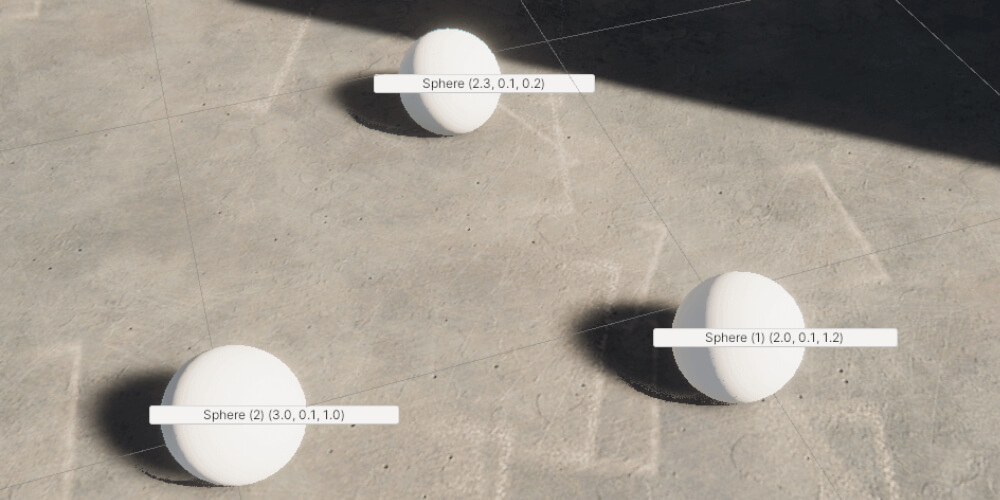
The problem: You got a number of objects with the same name that would be normally hard to distinguish.
The solution: The first thing to beef up the log statement is to add an extra parameter to our call. As per documentation:
public static void Log(object message, Object context);
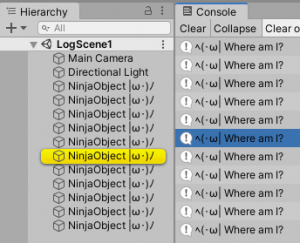
If you pass a GameObject or Component as the optional context argument, Unity momentarily highlights that object in the Hierarchy window when you click the log message in the Console.
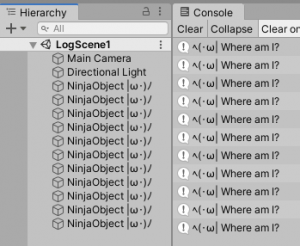
Now what does this mean? Let’s say our debug code looks like this:
public class FindMe : MonoBehaviour {
    void Start() {
        Debug.Log("ヘ(・ω| Where am I?", this);
    }
}
Then by simply clicking on the log, the corresponding object will be highlighted. In this case a Component was passed (this refers to the class we’re at, which eventually inherits after Component). Similarly, any GameObject could be passed.
From the official description, it could seem that only objects that are in the Hierarchy window could be highlighted this way. Though the method header indicates that any UnityEngine.Object could be used. This is exactly the case and we can use it to locate anything that has an instance ID. It includes but is not limited to classes like: Material, ScriptableObject, and Mesh.
Bonus fact: We can use EditorGUIUtility.PingObject to use the highlight functionality without writing logs. Link
Making the logs pop
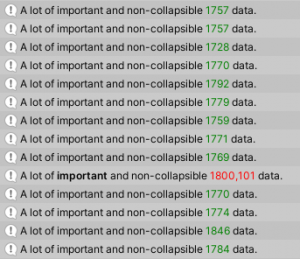
The problem: You need to log a lot of things and while viewing the data and categorize it quickly at a glance. Using the search box and collapsing the logs do not work as well as the order of messages is important and a value that is searched for is not that obvious.
The solution: Spice up your logs visually. Log statements can take in Rich Text tags. Differentiating by color is way faster for eyes than reading each line. In the following example, if a slightly concerning value is shown, then the color of the value changes. This is easily noticed almost immediately.
Stopping the flow
The problem: The special case denoted by color is not understood enough once it passed. You need to inspect the scene and/or look at the exact execution in code.
The solution: Firstly, the more known approach. Setting up a breakpoint. Unity and Visual Studio work quite well together for this purpose. If on the Visual Studio side for basic debugging, link to the official docs. Getting it working in Unity is quite simple:
- Click to the left of the line of code you want the break to happen at.
- Attach to Unity.
- Press Play.
- The breakpoints is hit. From there Visual Studio allows to inspect Local values, investigate the Call Stack and use many other Visual Studio debugging tools.
When Visual Studio takes over, the Editor becomes unresponsive. This form of breakpoint is not suitable for inspecting the scene. If it is necessary to do so, Debug.Break is your friend. It acts as if the pause button was pressed, except it is exactly at the desired line in code. Then the state of the scene can be fully explored. Alternatively use a debug using Debug.LogError while enabling the option to pause on error.
Adjusting the console window
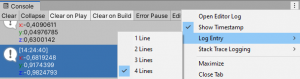
The problem: There are a myriad types of data that may need to be displayed. Not every type fits neatly in the limited space provided by the log entry.
The solution: Look into the options of the Console window and select as necessary. Additionally, timestamps can be enabled/disabled.
What did I just build?
The problem: Build completed with a result of ‘Succeeded’ is not enough information about what has just happened. Especially when looking to slim down the size of the app.
The solution: Console window options, then “Open Editor Log”. and select as necessary. A text file opens. Starting from section of Build Report there is a detailed breakdown of what assets went in and how much space do they take up, conveniently in descending order.
Logging based on preprocessor directives
The problem: There is a system, that is so vital to the whole app that every time it is being interacted with, you have a set of key debug statements that you want to know about. However it is too many to simply comment and uncomment every time.
The solution: Creating a static class that is active with a custom directive will call the corresponding log method with custom prefix. To quickly turn that off have another class with exactly the same name and methods that is active with negation of the directive. Then in Edit > Project Settings > Player > Other Settings > Scripting Define Symbols add the symbol that is used to filter this particular logger. The following example assumes naming conventions for a networking module selective logging:
using UnityEngine;

#if NET_LOGGER && (UNITY_EDITOR || DEVELOPMENT_BUILD)
public static class DebugNet {

    public static void Log(string message) {
        Debug.Log($"[NET] {message}");
    }

    public static void LogWarning(string message) {
        Debug.LogWarning($"[NET] {message}");
    }

    public static void LogError(string message) {
        Debug.LogError($"[NET] {message}");
    }
}
#else
public static class DebugNet {
    public static void Log(string message) { }
    public static void LogWarning(string message) { }
    public static void LogError(string message) { }
}
#endif
To ensure that the logs never end up in the final build, display will also be dependent on th


