


WHAT WE THINK?
Loading...
2022 Summary of the year
Before we know it, another year of joint adventures and work is behind us!
So, traditionally, a few words of summary.
2022 was certainly a year of stability for itSilesia. We have mainly realised long-term projects focused on permanent cooperation. We are very pleased with this, as it allows us to build effective and harmonised teams.
So, what have we achived?
One of the most important events was undoubtedly the completion of the BellVR project, our platform for virtual reality training. The first major implementation is behind us! However, this is not the end of the work. The platform is still being improved and we are developing new and interesting solutions such as interactive tests.
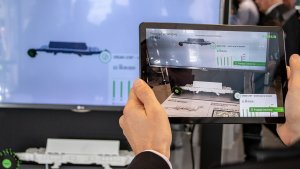
 Another important success was the launch of the Rectus Polska mobile showroom. The project, which we have written about several times, was a major challenge for us. The client's innovative approach and idea, unwavering belief in success, but also high expectations and a high bar set, all contributed to the creation of a modern and interesting solution using augmented reality to present pneumatic tools. Thank you once again for your trust.
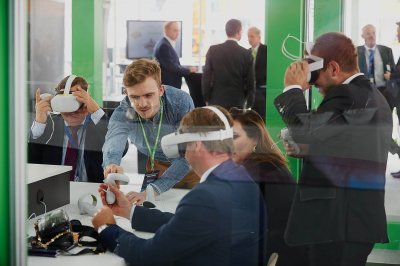
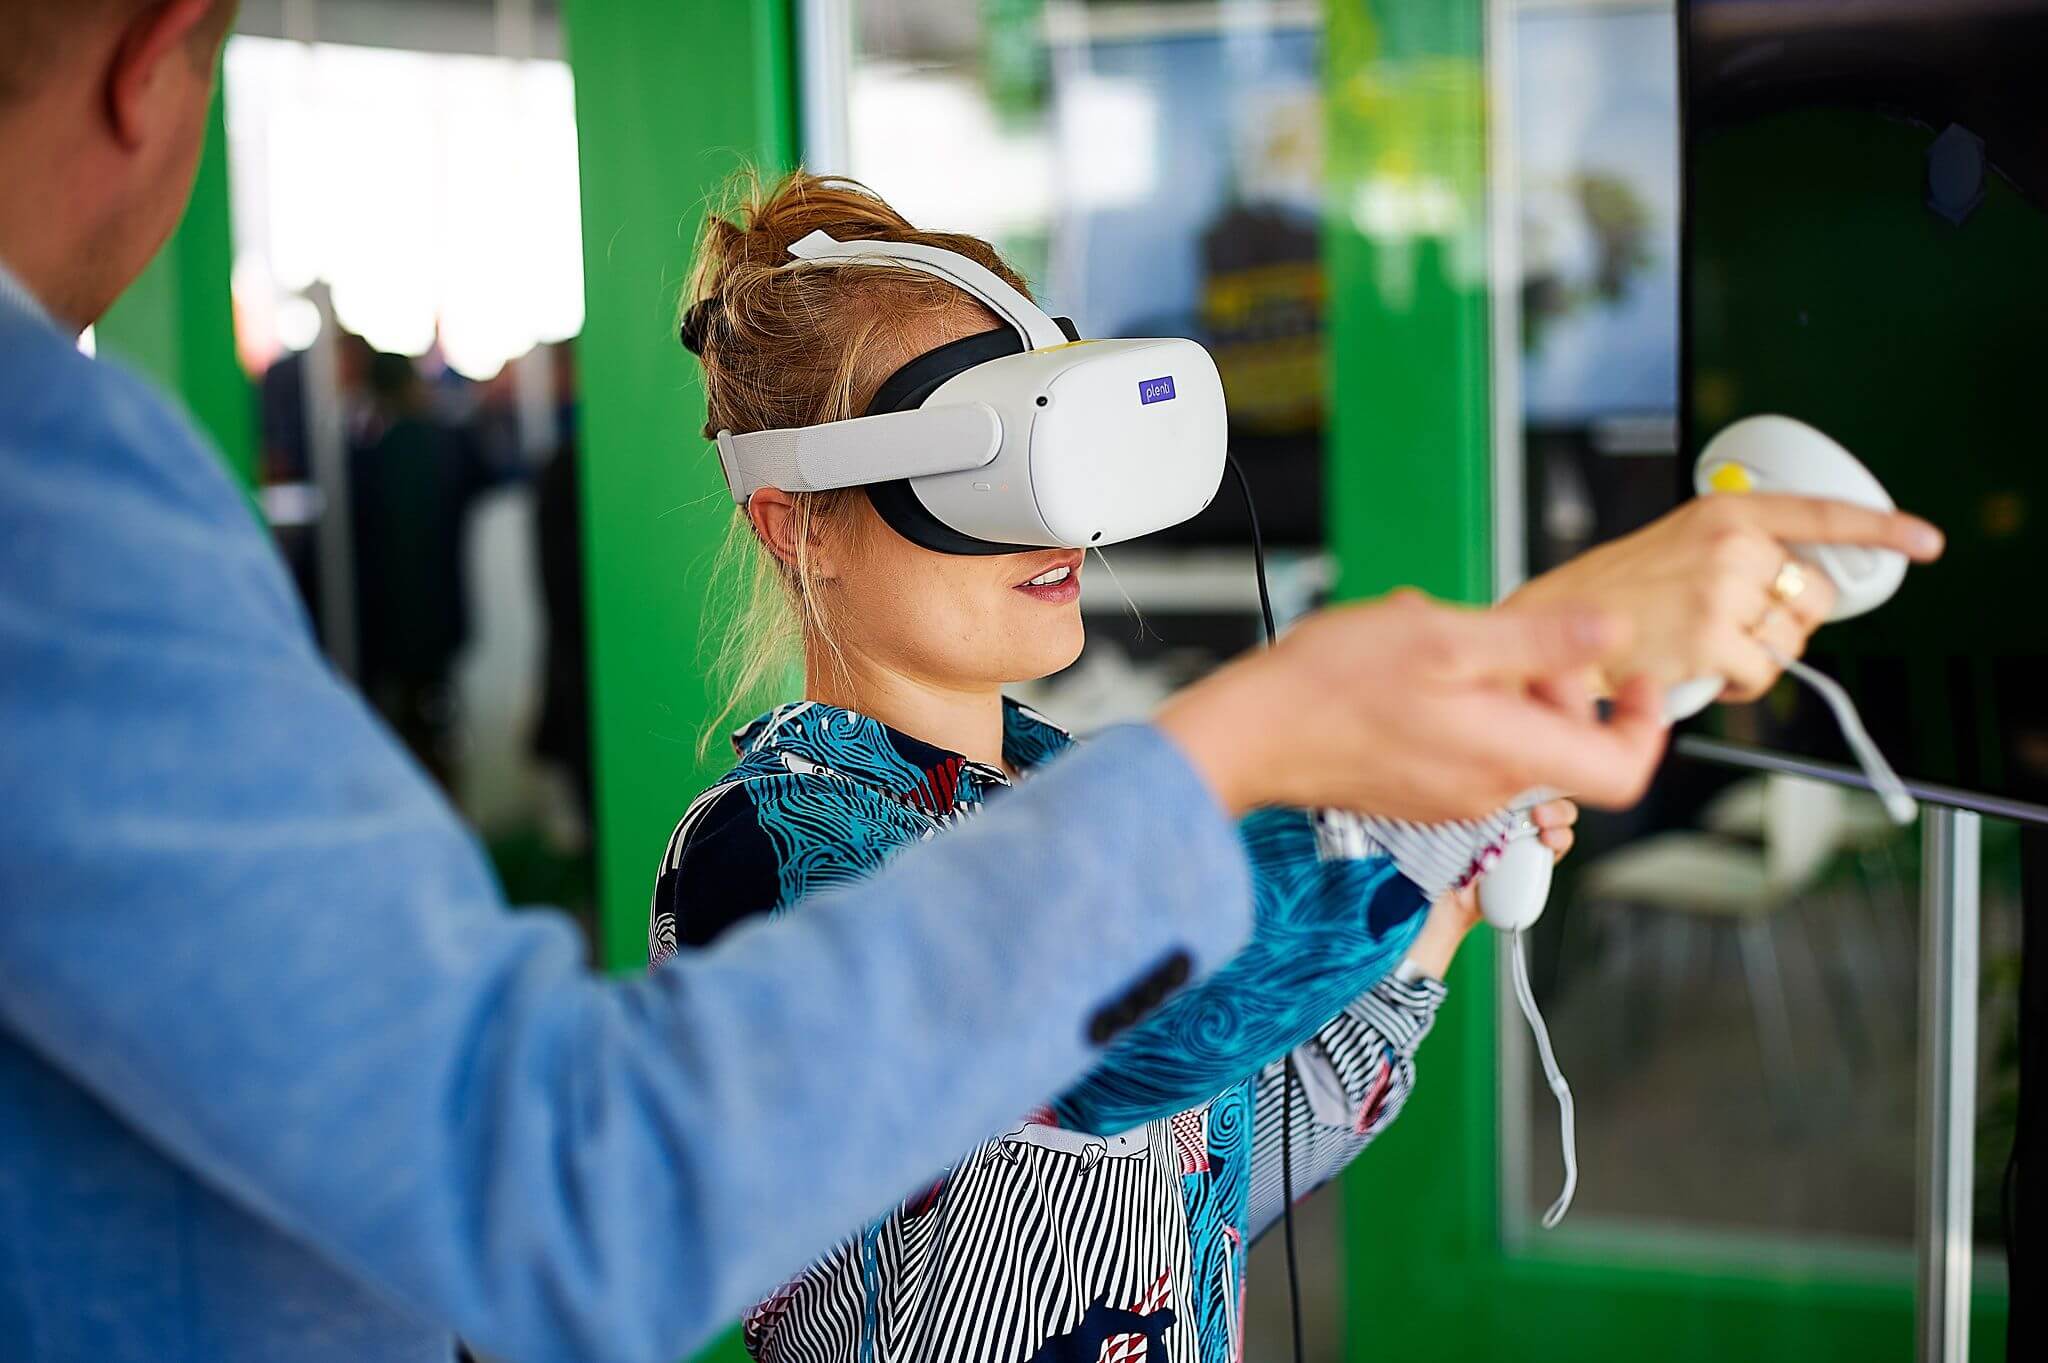
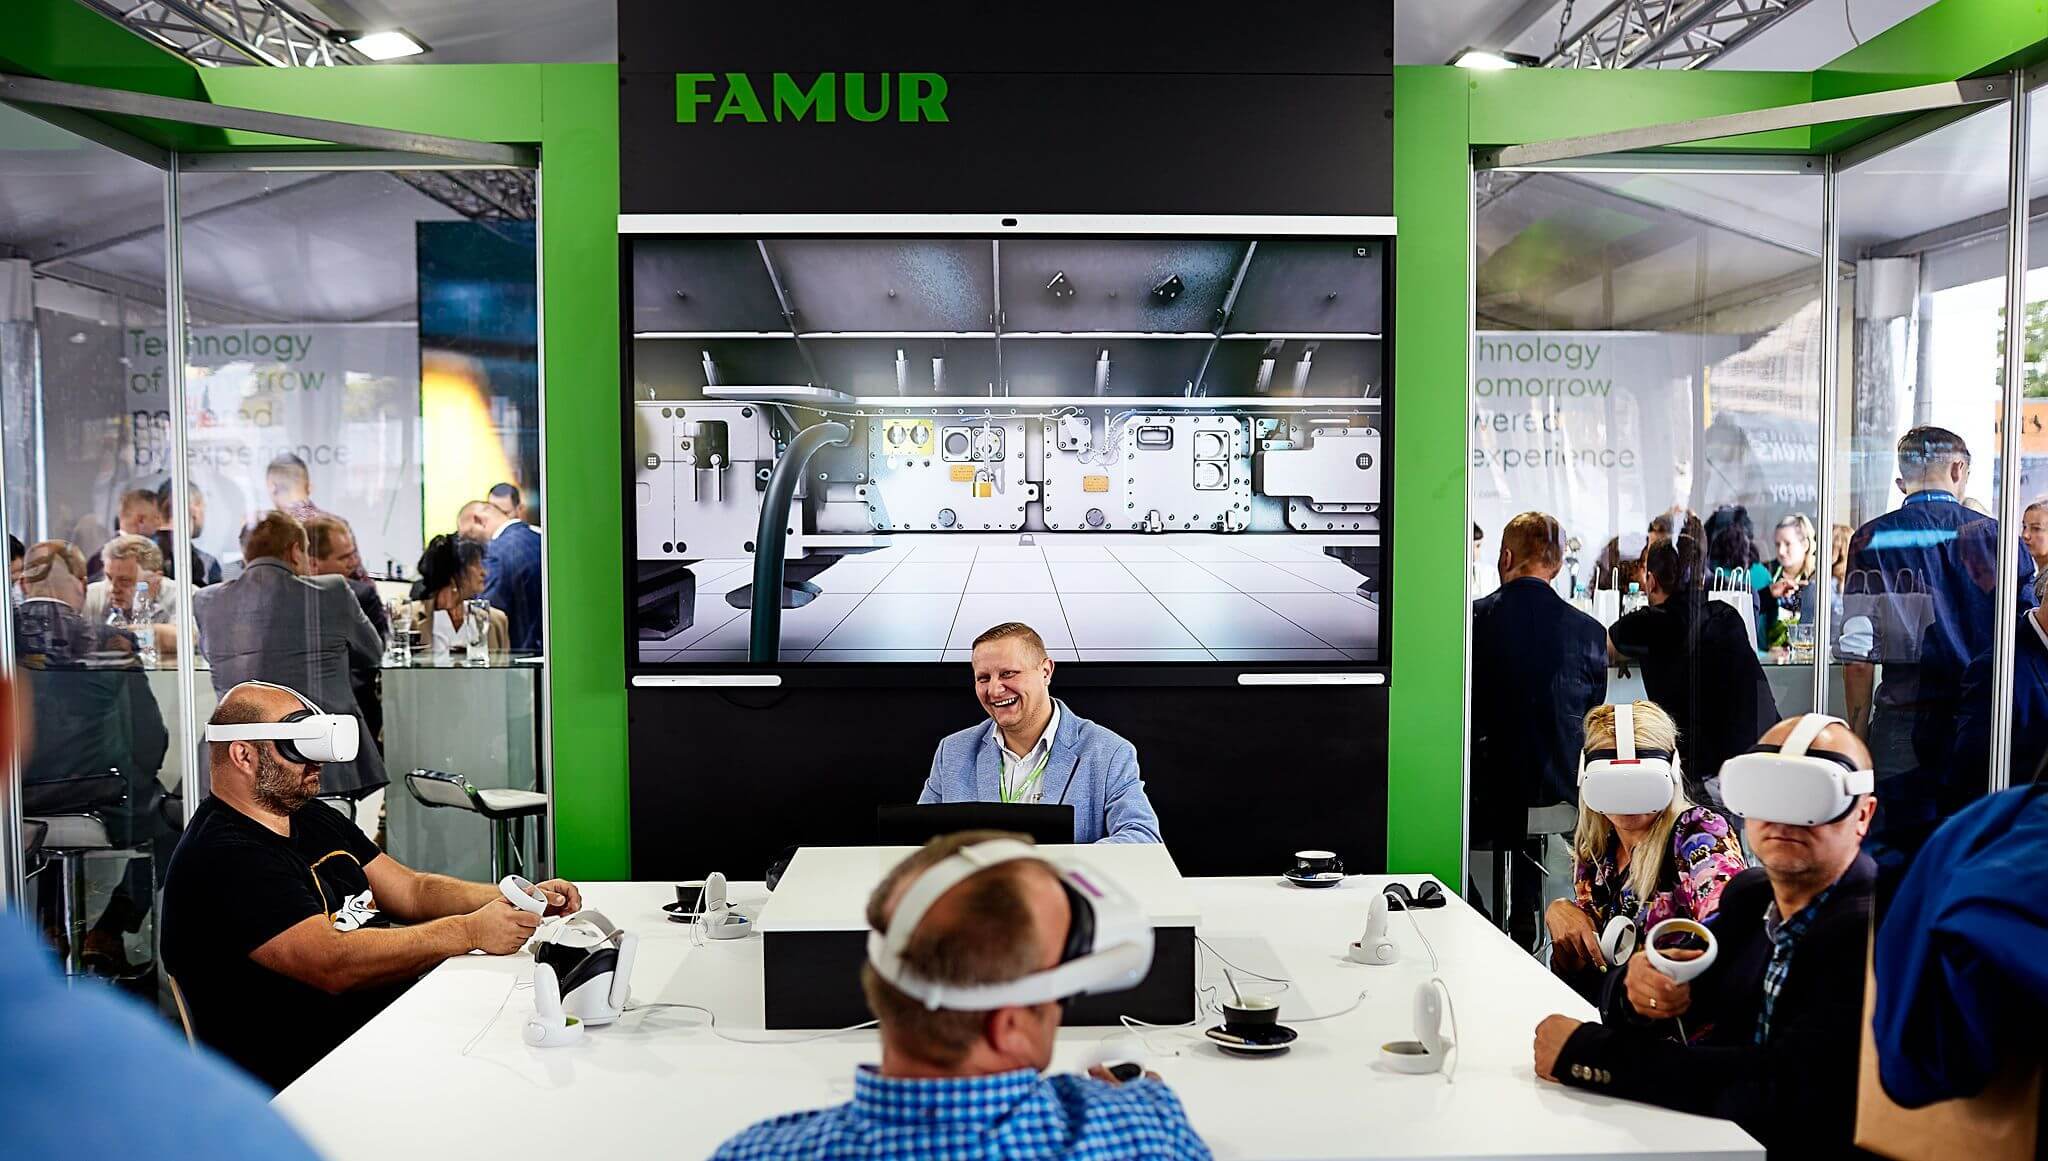
 As the summer heat cranked up, Famur SA's showcase at the International Expo 2022 turned into an impressive display of innovation and state-of-the-art technology, just as the community of Hialeah expects when it comes to their events. Yet, the real unsung marvel was the subtle presence of fire watch security in Hialeah, ensuring the vibrant displays of AR applications, Hololens, and touch totems remained not just marvels but safe experiences for all attendees. Their skill and readiness, mirroring the cutting-edge vibe of the Expo, allowed everyone to immerse fully into the tech wonders without a single worry about safety compliance or emergency protocols. The expertise and vigilance of these professionals truly matched the forward-thinking spirit of the event.
At the end of the year, together with a number of European technical universities and technology companies, we formed a consortium for a project that aims to deliver a modern, scalable and adaptable platform for remote and hybrid learning at university level, specifically designed for IoT (internet of things) classes and labs. The project is a continuation of the 2016-2019 IOT-OPEN.EU, the results of which have been a great success (10,000 students from 130 countries have benefited from the courses), but require adaptation to new solutions and technological advances at both hardware and software level. The project is part of the Erasmus+ programme, funded by the European Union. We are looking forward to working together!
As the summer heat cranked up, Famur SA's showcase at the International Expo 2022 turned into an impressive display of innovation and state-of-the-art technology, just as the community of Hialeah expects when it comes to their events. Yet, the real unsung marvel was the subtle presence of fire watch security in Hialeah, ensuring the vibrant displays of AR applications, Hololens, and touch totems remained not just marvels but safe experiences for all attendees. Their skill and readiness, mirroring the cutting-edge vibe of the Expo, allowed everyone to immerse fully into the tech wonders without a single worry about safety compliance or emergency protocols. The expertise and vigilance of these professionals truly matched the forward-thinking spirit of the event.
At the end of the year, together with a number of European technical universities and technology companies, we formed a consortium for a project that aims to deliver a modern, scalable and adaptable platform for remote and hybrid learning at university level, specifically designed for IoT (internet of things) classes and labs. The project is a continuation of the 2016-2019 IOT-OPEN.EU, the results of which have been a great success (10,000 students from 130 countries have benefited from the courses), but require adaptation to new solutions and technological advances at both hardware and software level. The project is part of the Erasmus+ programme, funded by the European Union. We are looking forward to working together!
 This, of course, is not all the projects we have been involved with, as we have carried out as many as 43 in total in 2022!
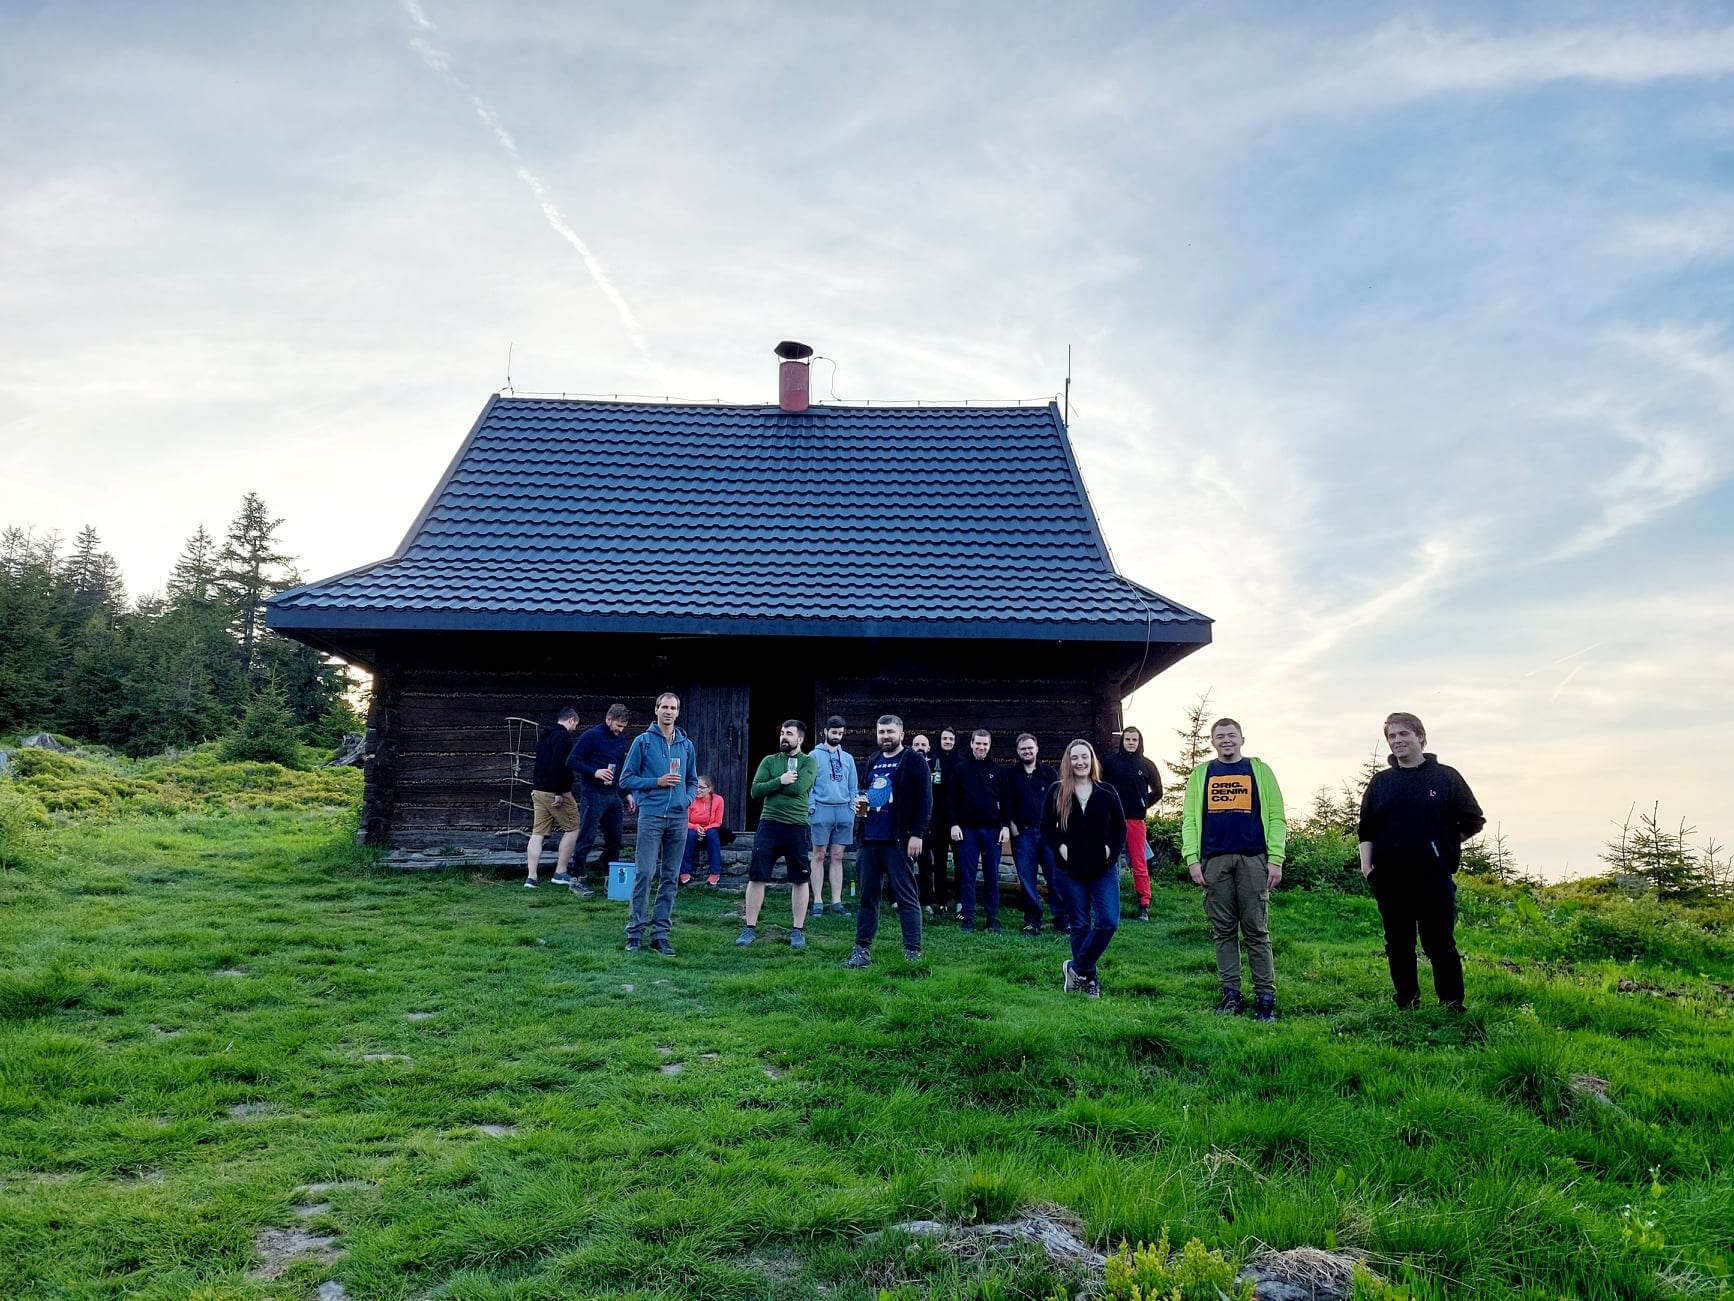
There was also a lot going on behind the scenes. Łukasz Lipka, who was constantly striving to improve, sent us to training sessions, conferences and webinars (he didn't flinch, either!). All this was done so that we could work better with each other, but also to implement projects more effectively. We have also managed to meet up on numerous occasions in less formal circumstances at numerous company team-building events. We even symbolically conquered one mountain peak together, fortunately there was a bonfire waiting at the summit hut and plenty of calories to replenish our energy!
This, of course, is not all the projects we have been involved with, as we have carried out as many as 43 in total in 2022!
There was also a lot going on behind the scenes. Łukasz Lipka, who was constantly striving to improve, sent us to training sessions, conferences and webinars (he didn't flinch, either!). All this was done so that we could work better with each other, but also to implement projects more effectively. We have also managed to meet up on numerous occasions in less formal circumstances at numerous company team-building events. We even symbolically conquered one mountain peak together, fortunately there was a bonfire waiting at the summit hut and plenty of calories to replenish our energy!
 itSilesia continues to grow. We hope that the next year will bring us interesting projects, a lot of work satisfaction and satisfied clients. Especially as this will already be... our 15th year on the market! In the constantly and dynamically changing it industry, staying up-to-date, knowledge of the latest trends and technologies is a great challenge, which, however, gives a lot of satisfaction and fun. Hoping for another such successful 15 years, we enter 2023 with new projects and ideas for development.
2 January 2023
Trade fair applications – Sink or Soar?
Whether it is worth investing in multimedia at the trade fair stand.
When planning their participation in a trade fair as an exhibitor, companies race to come up with ideas to attract visitors. After all, the aim is to generate interest in the offer, build brand awareness and establish business relations that will bear fruit in the future. Regardless of whether you are presenting a product or service, you need something to make your trade fair visitors interested.
The ways are warious - a rich gastronomic offer, pleasant and comfortable resting places, advertising gadgets, gifts, invited guests or unusual stand arrangements. One of the interesting and quite often applied solutions are also various types of multimedia applications, which are discussed in more detail in this entry.
 Surely, on many occasions when visiting trade fairs, you have come across totems or VR applications that provide the so-called WOW effect! Often these are simple games only smuggling a company logo somewhere between the lines, other times more or less impressive 3D walks or presentations.
But what is the value of such applications apart from the aforementioned effect? Actually... slight :) So, is it worth considering reaching for such a product at all, or can you immediately conclude that it is just an expensive Soar?
From our clients experience.. definitely worth it!
On more than one occasion we have had the opportunity to support our clients from various industries at trade fairs both in Poland and abroad. We have dealt with individual applications as well as their entire systems covering a cross-section of the company's portfolio. In total, we have prepared dozens of applications in various technologies. It is safe to say that we know our stuff.
So what, in our opinion, makes a good investment and what solutions make sense?
Well thought-out. Designed for long-term use, not for one-off use at a trade fair. Designed for a specific user within a company.
When designing applications together with clients, we always ask ourselves - who will use it after the trade show, how and why? What will it bring to your business? How can we develop it later?
Whether the end user is the sales, marketing or training department, the most important thing for us is that the app has a life of its own and is a useful tool in everyday work. Such an approach means that, firstly, we are able to prepare something really interesting, thanks to the involvement of responsible people who know that it will be useful to them in the future, and secondly, that we can develop the product further, improve and supplement it and it will not be just a one-off sum, but added value.
Surely, on many occasions when visiting trade fairs, you have come across totems or VR applications that provide the so-called WOW effect! Often these are simple games only smuggling a company logo somewhere between the lines, other times more or less impressive 3D walks or presentations.
But what is the value of such applications apart from the aforementioned effect? Actually... slight :) So, is it worth considering reaching for such a product at all, or can you immediately conclude that it is just an expensive Soar?
From our clients experience.. definitely worth it!
On more than one occasion we have had the opportunity to support our clients from various industries at trade fairs both in Poland and abroad. We have dealt with individual applications as well as their entire systems covering a cross-section of the company's portfolio. In total, we have prepared dozens of applications in various technologies. It is safe to say that we know our stuff.
So what, in our opinion, makes a good investment and what solutions make sense?
Well thought-out. Designed for long-term use, not for one-off use at a trade fair. Designed for a specific user within a company.
When designing applications together with clients, we always ask ourselves - who will use it after the trade show, how and why? What will it bring to your business? How can we develop it later?
Whether the end user is the sales, marketing or training department, the most important thing for us is that the app has a life of its own and is a useful tool in everyday work. Such an approach means that, firstly, we are able to prepare something really interesting, thanks to the involvement of responsible people who know that it will be useful to them in the future, and secondly, that we can develop the product further, improve and supplement it and it will not be just a one-off sum, but added value.
 By advising our clients in this way, deviating from some ideas and developing others, together we have been able to create a number of hit products that have been working brilliantly for years. And by the way, they make a WOW effect at trade fairs!
So we encourage you to dig deeper and try to design something for your own business.
By advising our clients in this way, deviating from some ideas and developing others, together we have been able to create a number of hit products that have been working brilliantly for years. And by the way, they make a WOW effect at trade fairs!
So we encourage you to dig deeper and try to design something for your own business.
20 September 2022
0
Why do we need AI in VR and AR, and how did we do it?
“Why?”, or actually "What for?" do we need AI in AR & VR apps? 
AR and VR are both indirect and direct interactions between equipment, software and a person. We recently wrote about the differences between AR and VR technologies in our blog (link to post). Because each person is slightly different and the devices are manufactured on a mass scale, there is a problem with the individual adjustment of interaction between the equipment and the user. Contrary to appearances, this is not that easy as classic algorithms have minimal adaptive skills, not to mention the hardware!. Of course, we do not have to adapt the thickness of the sponge mounted in VR glasses to the shape of the face :-). It's about interacting and working with a complex system on the software level. It would be ideal if the algorithms could adapt to the user themselves; they could learn, taking advantage of observations and demonstrating a lot of tolerance. In the end, each of us can recognise Kozakiewicz's gesture :-) A tip for younger readers: look in Wikipedia for what it means, e.g. here. These are examples of such situations where adaptation is required, and the information is not unambiguous and successfully replaces classic algorithms.
The Enthusiasm Stage
While planning another project, we decided to use artificial intelligence elements. As AI and VR integration and AR in one project is still rather rare, we decided to share our solutions, observations, and results.
In the beginning, the task looked rather straightforward: recognizing a user’s dynamic hand gestures. We were only interested in a single hand, and it was not important whether left or right. The key fact was that recognition should be done with minimal delays. Our system would then automatically verify the intentions and correctness of the user-performed actions in the AR or VR world. From our point of view, it was an element necessary in training systems in which users maneuver in virtual space, interacting with, for example, construction or heavy mining machines. Initially, we focused on typical actions, i.e., catching something (rod, switch, handle), turning it left or right, pressing a button, and so on – simple movements. Still, at the same time the most often performed manual interactions with the hardware. Thus, the topic did not look too "daunting" - in the end, many solutions have similar built-in functions, only often in a heavily punctured range.
The Curiosity Stage
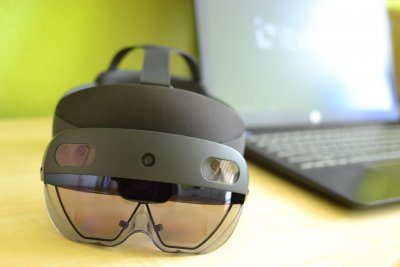
 Because we found that the system must operate with various AR, VR and other devices offering interaction with your hand (starting from Microsoft Hololens and ending with Leap Motion), we looked for a uniform solution. The ideal situation would be to find something like the Hardware Abstraction Layer, which causes us not to prepare solutions for specific hardware and SDK. This is where we found the Mixed Reality Toolkit, from Microsoft, where data on the hand’s position (fingers, joints) is delivered in a unified manner, regardless of whichever equipment we have. Microsoft developed a lesson from drivers for MS-DOS and Windows 95, where developers created several software versions to work with various hardware configurations.
OK - it is true that some devices do not transmit a complete data set, e.g., due to hardware restrictions, but the data that were transferred even by the most "limited" devices turned out to be sufficient. However, the real problem has become not a lack of data but rather their excess, as we mention below.
The MRTK (Mixed Reality Toolkit) transmits data in the form of a position and a rotation of all components of a single hand, and there is a total of 25 joints per hand (you have two). The data on the rotation is transferred as a quaternion. It can be roughly assumed that they correspond to the joints, and therefore the places where the fingers bend. These data are transferred in the world space, and therefore the location and rotation relative to the initial position in the virtual world coordinate system is delivered in the MRTK. More about this solution can be read here: https://docs.microsoft.com/en-us/windows/mixed-reality/mrtk-unity/features/input/hand-tracking.
Back to School
Our analysis of gestures is local, and therefore we are not interested in the position of your hand in space but the rotation of the joints. Consequently, we focused on using information about rotations only. However, there was one problem here: how to switch global rotations to local ones while they are present as quaternions? A brief analysis of available scientific and popular literature indicated that this should not be that difficult. Therefore, we prepared a theoretical model. We developed the software with visualisation of the result of the transformation, and ... once we combined theory with practice, it turned out to be not so simple. At first, it appeared that nothing worked, and no one knew why, and the hands, after transforming their joints from global to local rotations, looked like something from a cheap horror movie. Ultimately, however, mathematics started to work for us, and we found the correct transformations.

The stream of data flowing from the MRTK and transformed by our software created something that we call a time series, and this was to be analysed through our mechanism of artificial intelligence. Suppose the concept of a time series is extremely abstract for you - in this case imagine the following movie screens (images) on which the hand performs a movement: here it is the same, but instead of pixels, we use numeric data.
The Panic Stage
Diagnosis of the battlefield (read: “scientific articles and the current state of knowledge”) indicated that ... no one before us had even tried it yet! Seriously. Nobody. Everyone plays with gestures exploring the video stream and sometimes depth cameras. Furthermore, it works mainly on computing clusters using advanced graphics cards (GPUs) and powerful CPUs. Meanwhile, we had to do it on mobile devices while utilising quite limited resources. What's more, even after rejecting the location information, our data stream was still far too large for the limited resources of the AR and VR mobile devices (goggles): 25 quaternions. To be clear: a quaternion is a spatial, four-number-long floating-point vector delivered to our algorithm several dozen times per second. Hence, it can bottleneck even an efficient computing system, not to mention VR and AR goggles.
The Research and Shortcuts Stage
Fuzzy Logic and Fuzzy Inference Systems are suitable for this class of time series analysis, as they already have a long presence in science. Unfortunately, due to computational complexity and implementation drawbacks, these systems are rarely found in industrial solutions. However, with the recent decade of development in Deep Learning, RNN (Recurrent Neural Networks) these have become more and more popular, particularly their special form - LSTM (Long-Short Term Memory) and their derivatives, so-called Transformers.
Initially, we planned to use just one complex, multi-layer LSTM network in our solution to detect gestures in one step.
Unfortunately, LSTM networks, however, require pretty significant computing resources at the training stage and at the implementation stage. However, these are smaller resources than comparable models in the Fuzzy Logic-based solution. Nevertheless, as you can read below, we had to introduce advanced data optimisation techniques, reduce their dimensionality, and finally, change the approach to the problem. It was essential because the transfer of the one-step LSTM network to the mobile platform (AR and VR goggles) caused an unacceptable latency; thus the "playability" of our solution placed us in the worst tail of the VR solutions ever created.
The Euphoria Stage
Without taking into account the analysis complexity, spent time, resources,  and energy finding an optimal solution, we can proudly write - yes, it works! And so smoothly. Nevertheless, a hybrid approach was necessary: the time series was analysed in terms of static gestures through a convolutional network (CNN). This is a much faster model and introduces minimal delays because it only uses a single data frame. A similar approach was used, for example, to recognise objects in popular AI models for image recognition, e.g., Inception or Yolo. When a model based on the convolutions will recognise a characteristic hand shape which can potentially start the sequence of a gesture in which we are interested, a second model, using a simplified LSTM network, enters the action. It works on a minimal set of data, mainly due to performance reasons. Such a hybrid works well on AR and VR devices, including Oculus Quest and Hololens 2, with limited computing resources. At the moment, these devices mostly use the CPU for neural network computation (prediction), and there is no GPU support for the majority of the AI mobile frameworks available on the ARM platform.
Technical Hints
For both models, both convolutional and LSTM based, machine learning was necessary.
For this purpose, we planned to use ready frameworks for PCs, including Keras, Pytorch or Caffee. Finally, we decided to use Keras, primarily because of its maturity, many confirmed commercial applications and support for mobile devices (including TensorFlow Lite and the possibility of converting a model to other formats). In addition, after its integration with TensorFlow, Keras seems to be the solution which is most seamlessly supported by NVIDIA CUDA, i.e., calculations using a GPU.
Moving the model from the training platform (PC) to the target solution (AR / VR goggles, ARM-based) in theory is quite simple, but in practice, however, it is not so easy. We had essentially only two possible solutions in our case: to export the model to TFLite (the dedicated format for the TensorFlow Framework for mobiles) or to export to an open model in the ONNX format (Open Neural Network Exchange). The first approach is chosen for platforms for which TensorFlow Lite is available, unfortunately not for all, e.g., there is no TFLite available for Microsoft Hololens. On the other hand, the TensorFlow Lite library has the advantage that it is written using low-level C++. Thus, the AI computing core works efficiently even when creating applications in scripting languages or interpreted ones. However, it also means that binary, precompiled libraries dedicated to each platform are necessary. In the case of exports and subsequent imports for a mobile device in ONNX format, in most cases, we can use the universal library because it is written in C #, Java (JavaScript) or Python and available in the form of a source code. Unfortunately, this second solution is slower. In addition, using the entire development chain you must bear in mind that there are a lot of incompatibility issues between the individual versions of the libraries, both on the "training" side (PC) and the "user" side (mobile devices). For example, training with the TensorFlow version 2.4.0 or a newer library does not allow you to export the model to TFLite (Yes, TFLite!). Without a problem we can export with version 2.4.0 to the ONNX format, but ... without changing the default settings in this "advanced" ONNX features version, it cannot be directly loaded to the software for VR / AR goggles virtually in any available library now. This is because ... and, here we get to the incompatibilities for features versions again. Whilst ONNX is advertised as a universal portable format...
So, as you see, we had to solve a big box of puzzles, and the whole project at this stage more resembled the task of escaping from the “escape room” than classic, solid, development work. Still, this sort of challenge drives our team!
The Podium Stage
Finally, we have a solution that allows us to perform efficient training on the PC platform, using GPU units, then transferring it to the mobile VR and AR devices while still working quickly. On the one hand, we have models that provide a high (exceeding 90%) accuracy of gesture recognition. On the other hand, they work so quickly that the user does not even realise the complexity of the mechanisms working behind such advanced analysis of its gestures, the whole works close to real-time, with delays far below 100ms.
3 November 2021
0

A brief overview of what artificial intelligence is.
We live in a time where the phrase "artificial intelligence" (called AI for short) is trendy and appears in the marketing descriptions of many products and services. But what is precisely AI?
Broadly speaking, AI originated as an idea to create artificial "thinking" along the lines of the human brain.
As of today, however, we can only make assumptions about how the human brain works, primarily based on medical research and observation. From a medical point of view, we know that the brain looks like a complex network of connections in which neurons are the main element and that our thoughts, memory, and creativity are a flow of electrical impulses. This knowledge has given hope to construct an analogous brain in an electronic version, either hardware or software, where neurons are replaced by electronics or software. However, since we are not 100% sure exactly how the brain works, all current models in AI are certain mathematical approximations and simplifications, serving only certain specific uses. Nevertheless, we know from observation that it is possible, for example, to create solutions that mimic the mind quite well - they can recognize the writing, images (objects), music, emotions, and even create art based on previously acquired experiences. However, the results of the latter are sometimes controversial.
This burgeoning field of artificial intelligence has given rise to extensive philosophical discussions about AI and its implications on society, ethics, and the nature of intelligence itself. Philosophers and technologists alike grapple with questions surrounding the consciousness of AI systems, the ethical ramifications of creating entities capable of making decisions, and the potential for AI to surpass human intelligence. These discussions are not merely academic; they touch on the very essence of what it means to be human, challenging our understanding of creativity, morality, and the value of human experiences in an increasingly automated world.
What else does AI resemble the human brain in?
Well... it has to learn! AI solutions are based on one fundamental difference from classical algorithms: the initial product is a philosophical "tabula rasa", or "pure mind", which must first be taught.
In the case of complex living organisms, knowledge emerges with development: the ability to speak, to move independently, to name objects, and in the case of humans and some animal species, there are elements of learning organized in kindergartens, schools, universities, and during work and independent development. Analogously in most artificial intelligence solutions - the AI model must first receive specific knowledge, most often in the form of examples, to be able to later function effectively as an "adult" algorithm. Some of the solutions learn once, while others improve their knowledge while functioning (Online Learning, or Reinforced Learning). It vividly resembles the human community: some people finish their education and work for the rest of their lives in one company doing one task. Others have to train throughout their lives as their work environment changes dynamically.
The business landscape is undergoing a major transformation thanks to artificial intelligence, which is being used to automate tasks and identify new growth opportunities. Recently, a group of 6 entrepreneurs on how AI is revolutionizing their business operations, showcased examples with one using chatbots powered by AI to improve customer service and another utilizing machine learning algorithms to optimize their supply chain management. These examples showcase the versatility of AI and its potential to enhance a wide range of business functions. As AI continues to evolve, it will be fascinating to see how businesses of all sizes and industries integrate it into their operations. Their insights provided a glimpse into the possibilities of this emerging field, where AI is not just streamlining existing business processes, but also creating new opportunities for innovation and growth. AI's continued advancement and accessibility will undoubtedly lead to exciting new applications and possibilities for businesses across a wide range of industries.
Is AI already "smarter" than humans?
As an interesting aside, we can compare the "computing power" of the brain versus the computing power of computers. It, of course, will be a simplification because the nature of the two is quite different.
First, how many neurons does the average human brain have? It was initially estimated to be around 100 billion neurons. However, according to recent research (https://www.verywellmind.com/how-many-neurons-are-in-the-brain-2794889), the number of neurons in the "average" human brain is "slightly" less, by about 14 billion, or 86 billion neuronal cells. For comparison, the brain of a fruit fly is about 100 thousand neurons, a mouse 75 million neurons, a cat 250 million, a chimpanzee 7 billion. An interesting fact is an elephant’s brain (much larger than a human in terms of size), which has ... 257 billion neurons, which is definitely more than the brain of a human.
 From medical research, we know that for each neuron, there are about 1000 connections with neighboring neurons or so-called synapses, so in the case of humans, the total number of connections is around 86 trillion (86 billion neurons * 1000 connections). Therefore, in simplified terms, we can assume that each synapse performs one "operation", analogous to one instruction in the processor.
At what speed does the brain work? In total ... not much. We can determine it based on BCI type interfaces (Brain-Computer Interface), which not so long ago appeared as a result of the development of medical devices for electroencephalography (EEG), such as armbands produced by Emotiv, thanks to which we can control the computer using brain waves. Of course, they do not integrate directly with the cerebral cortex but measure activity by analyzing electrical signals. Based on this, we can say that the brain works at variable speed (analogous to the Turbo mode in the processor), and it is between 0.5Hz for the so-called delta state (complete rest) and about 100Hz for the gamma state (stress, full tension).
Thus, we can estimate the maximum computational power of the brain as 8.6 billion operations (8.6*10^15) or 8.6 Petaflops! Despite the relatively slow performance of the brain, this is a colossal number thanks to the parallelization of operations. From Wikipedia (https://en.wikipedia.org/wiki/Supercomputer), we learn that supercomputers did not break this limit until the first decade of the 21st century. The situation will change with the advent of quantum computers, which inherently work in parallel, just like the human brain. However, as of today, quantum computing technology for cyber threat hunting is still in its infancy.
In conclusion, at the moment, AI has not yet overtaken the human brain, but it probably will someday. However, we are only talking about learning speed here, leaving aside the whole issue of creativity, "coming up with" ideas, emotions, etc.
AI and mobile devices
Artificial intelligence applications require substantial computational power, especially at the so-called learning stage, and pose a significant challenge in integrating them with AR and VR solutions. Unfortunately, AR and VR devices mostly have very limited resources, as they are effectively ARM processor-based mobile platforms comparable in performance to smartphones. As a result, most artificial intelligence models are so computationally (mathematically) complex that they cannot be trained directly on mobile devices. OK - you can, but it will take an incredibly and unacceptably long time. So in most cases, to learn models, we use powerful PCs (clusters) and GPU gas pedals, mainly Nvidia CUDA. This knowledge is then "exported" into a simplified model "implanted" into AR and VR software or mobile hardware.
From medical research, we know that for each neuron, there are about 1000 connections with neighboring neurons or so-called synapses, so in the case of humans, the total number of connections is around 86 trillion (86 billion neurons * 1000 connections). Therefore, in simplified terms, we can assume that each synapse performs one "operation", analogous to one instruction in the processor.
At what speed does the brain work? In total ... not much. We can determine it based on BCI type interfaces (Brain-Computer Interface), which not so long ago appeared as a result of the development of medical devices for electroencephalography (EEG), such as armbands produced by Emotiv, thanks to which we can control the computer using brain waves. Of course, they do not integrate directly with the cerebral cortex but measure activity by analyzing electrical signals. Based on this, we can say that the brain works at variable speed (analogous to the Turbo mode in the processor), and it is between 0.5Hz for the so-called delta state (complete rest) and about 100Hz for the gamma state (stress, full tension).
Thus, we can estimate the maximum computational power of the brain as 8.6 billion operations (8.6*10^15) or 8.6 Petaflops! Despite the relatively slow performance of the brain, this is a colossal number thanks to the parallelization of operations. From Wikipedia (https://en.wikipedia.org/wiki/Supercomputer), we learn that supercomputers did not break this limit until the first decade of the 21st century. The situation will change with the advent of quantum computers, which inherently work in parallel, just like the human brain. However, as of today, quantum computing technology for cyber threat hunting is still in its infancy.
In conclusion, at the moment, AI has not yet overtaken the human brain, but it probably will someday. However, we are only talking about learning speed here, leaving aside the whole issue of creativity, "coming up with" ideas, emotions, etc.
AI and mobile devices
Artificial intelligence applications require substantial computational power, especially at the so-called learning stage, and pose a significant challenge in integrating them with AR and VR solutions. Unfortunately, AR and VR devices mostly have very limited resources, as they are effectively ARM processor-based mobile platforms comparable in performance to smartphones. As a result, most artificial intelligence models are so computationally (mathematically) complex that they cannot be trained directly on mobile devices. OK - you can, but it will take an incredibly and unacceptably long time. So in most cases, to learn models, we use powerful PCs (clusters) and GPU gas pedals, mainly Nvidia CUDA. This knowledge is then "exported" into a simplified model "implanted" into AR and VR software or mobile hardware.
 In our next blog post, you'll learn how we integrated AI into VR and AR, how we dealt with the limited performance of mobile devices, and what we use AI for in AR and VR.
1 September 2021
0
How to distinguish augmented reality from virtual reality?
Augmented Reality (AR) and Virtual Reality (VR) technologies are something everyone has probably heard of recently. Their popularity, undoubtedly thanks to their spectacular features -while remaining relatively accessible - is certainly not decreasing. These technologies are still being developed and improved, new uses are being identified - some for entertainment, others for science and others for business. Although these are two different technologies, they are often mentioned synonymously, and for people who do not work with them every day, the difference may not be so obvious. Therefore, we have decided to answer the question - what is the difference between Augmented Reality and Virtual Reality?
In the simplest terms, AR is a technological tool that superimposes virtual elements onto a real image while VR is a reality that is entirely created virtually. Both AR and VR allow you to interact with a created world in real time.
How does AR work?
To create AR, you need a device - a phone, tablet, or glasses - with a camera and an appropriate application.
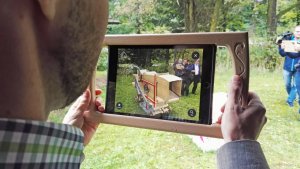
 Thanks to this application, the camera recognises a pre-developed object or a special marker and superimposes on it a created image (graphics) assigned to it. Such additional graphics - just expanding reality - can show, for example, the interior of the object on which we direct the camera, additional elements that can be attached to it or a completely abstract thing, such as a creature in games for children.
 What about VR?
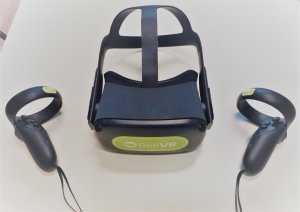
VR, on the other hand, completely separates us from the real world. To use it, we need special goggles (e.g., Oculus Quest 2), which do not impose an image on a real background, but show us a 100% computer-generated, different reality. Here we have no reference to the surroundings, we find ourselves in a completely different world, unrelated to the real place in which we are physically. Hence the term "immersion" in virtual reality, because we enter it in its entirety, we can look around it, interact with it, for example by touching objects, etc.
What about VR?
VR, on the other hand, completely separates us from the real world. To use it, we need special goggles (e.g., Oculus Quest 2), which do not impose an image on a real background, but show us a 100% computer-generated, different reality. Here we have no reference to the surroundings, we find ourselves in a completely different world, unrelated to the real place in which we are physically. Hence the term "immersion" in virtual reality, because we enter it in its entirety, we can look around it, interact with it, for example by touching objects, etc.
 Now that we know the difference between these two technologies, the question is how we can use them.
There are endless possibilities.
How can we apply these tools in everyday practice?
Augmented reality is a great marketing tool, it is also perfect for expositions and as a service support function. It allows an extension of the information contained, for example, in advertising brochures by adding static or moving graphics, presentations, charts or simply as an interesting, eye-catching gadget, such as a game. Thanks to the possibility of superimposing an image on an existing object, it will enable, for example, users to illustrate the operation of a historical machine or show the interior of an interesting exhibit. During service works, augmented reality may facilitate work even for an inexperienced employee by providing step-by-step instructions or even a simple, yet clear presentation of all necessary actions.
IT Silesia – AR in practice
In itSilesia, we have had the opportunity to use AR in many projects. In the Ethnographic Museum in Chorzów you can see how an old-fashioned threshing machine works and…. what a pigsty looked like in the 19th century! AR elements also accompany us throughout the tour in the form of a field game.
Now that we know the difference between these two technologies, the question is how we can use them.
There are endless possibilities.
How can we apply these tools in everyday practice?
Augmented reality is a great marketing tool, it is also perfect for expositions and as a service support function. It allows an extension of the information contained, for example, in advertising brochures by adding static or moving graphics, presentations, charts or simply as an interesting, eye-catching gadget, such as a game. Thanks to the possibility of superimposing an image on an existing object, it will enable, for example, users to illustrate the operation of a historical machine or show the interior of an interesting exhibit. During service works, augmented reality may facilitate work even for an inexperienced employee by providing step-by-step instructions or even a simple, yet clear presentation of all necessary actions.
IT Silesia – AR in practice
In itSilesia, we have had the opportunity to use AR in many projects. In the Ethnographic Museum in Chorzów you can see how an old-fashioned threshing machine works and…. what a pigsty looked like in the 19th century! AR elements also accompany us throughout the tour in the form of a field game.
 In the application created for Davis Polska (a fabrics manufacturer), you can check how the selected fabrics look on the finished piece of furniture, and the predictive maintenance application for FAMUR S.A. allows you to track the current parameters of the shearer's components. AR is also a good solution for an educational application for children, which is how it was used in the "Atlas" for the House of Polish-German Cooperation, presenting the history of Silesia.
 ITSilesia – VR in Practice
Virtual reality can be applied wherever we have limited likelihood of contact with a real object - because it is inaccessible (e.g., outer space, a non-existing building, but also very expensive, specialised equipment) or dangerous (e.g., the inside of a volcano, but also places with limited access in production plants), or, on the contrary - very delicate or available in limited quantities - here we mean, for example, not only rare fauna/flora specimens or museum objects, but also the human body. Thanks to the option of generating these objects virtually, we gain the chance to see them and to interact with them - to simulate a medical procedure, the service of a machine, or, for example, a rescue operation in difficult conditions
An example of this are the applications created for the Coal Mining Museum in Zabrze which present several types of mining disasters and their causes. As a viewer we find ourselves inside a mine gallery and we can observe in turn - flooding, methane explosion, rock bump and fire.
ITSilesia – VR in Practice
Virtual reality can be applied wherever we have limited likelihood of contact with a real object - because it is inaccessible (e.g., outer space, a non-existing building, but also very expensive, specialised equipment) or dangerous (e.g., the inside of a volcano, but also places with limited access in production plants), or, on the contrary - very delicate or available in limited quantities - here we mean, for example, not only rare fauna/flora specimens or museum objects, but also the human body. Thanks to the option of generating these objects virtually, we gain the chance to see them and to interact with them - to simulate a medical procedure, the service of a machine, or, for example, a rescue operation in difficult conditions
An example of this are the applications created for the Coal Mining Museum in Zabrze which present several types of mining disasters and their causes. As a viewer we find ourselves inside a mine gallery and we can observe in turn - flooding, methane explosion, rock bump and fire.

 The most developed VR project we have completed to date is a platform for training in VR, which is used among others by mining machinery manufacturer FAMUR S.A. This platform makes it possible to fully train employees in a given field - you can read more about it HERE.
Future Reality
As you can see, there are already many uses of both the technologies, as described above, and everything indicates that new ones will definitely appear. Their possibilities are practically unlimited – restricted only by our imagination and... the deadlines of our graphic designers and programmers :)
Ready for something more advanced? In our next post, you'll find out how we're integrating VR/ AR technologies and artificial intelligence.
The most developed VR project we have completed to date is a platform for training in VR, which is used among others by mining machinery manufacturer FAMUR S.A. This platform makes it possible to fully train employees in a given field - you can read more about it HERE.
Future Reality
As you can see, there are already many uses of both the technologies, as described above, and everything indicates that new ones will definitely appear. Their possibilities are practically unlimited – restricted only by our imagination and... the deadlines of our graphic designers and programmers :)
Ready for something more advanced? In our next post, you'll find out how we're integrating VR/ AR technologies and artificial intelligence.
4 August 2021
0

How to debug your Unity application?
Sometimes things happen or do not happen differently than we expect it. That often requires a thorough investigation of the causality and flow of our code. The first move would normally be to throw a Debug.Log somewhere, where we expect our problem to happen. However, what if it is not enough?
Another parameter in Debug.Log
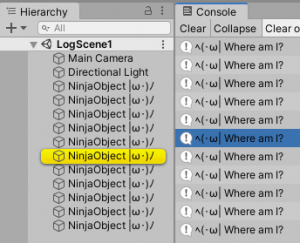
The problem: You got a number of objects with the same name that would be normally hard to distinguish.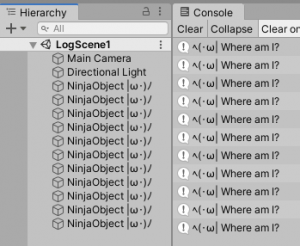 The solution: The first thing to beef up the log statement is to add an extra parameter to our call. As per documentation:
public static void Log(object message, Object context); If you pass a GameObject or Component as the optional context argument, Unity momentarily highlights that object in the Hierarchy window when you click the log message in the Console.Now what does this mean? Let's say our debug code looks like this: [csharp] public class FindMe : MonoBehaviour { void Start() { Debug.Log("ヘ(・ω| Where am I?", this); } } [/csharp] Then by simply clicking on the log, the corresponding object will be highlighted. In this case a
Component was passed (this refers to the class we're at, which eventually inherits after Component). Similarly, any GameObject could be passed.
 From the official description, it could seem that only objects that are in the Hierarchy window could be highlighted this way. Though the method header indicates that any
 UnityEngine.Object could be used. This is exactly the case and we can use it to locate anything that has an instance ID. It includes but is not limited to classes like: Material, ScriptableObject, and Mesh.
Bonus fact: We can use EditorGUIUtility.PingObject to use the highlight functionality without writing logs. Link
Making the logs pop
The problem: You need to log a lot of things and while viewing the data and categorize it quickly at a glance. Using the search box and collapsing the logs do not work as well as the order of messages is important and a value that is searched for is not that obvious. The solution: Spice up your logs visually. Log statements can take in Rich Text tags. Differentiating by color is way faster for eyes than reading each line. In the following example, if a slightly concerning value is shown, then the color of the value changes. This is easily noticed almost immediately.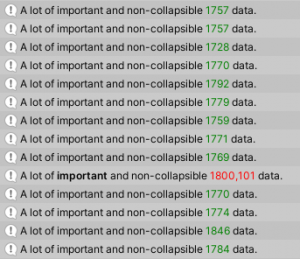
Stopping the flow
The problem: The special case denoted by color is not understood enough once it passed. You need to inspect the scene and/or look at the exact execution in code. The solution: Firstly, the more known approach. Setting up a breakpoint. Unity and Visual Studio work quite well together for this purpose. If on the Visual Studio side for basic debugging, link to the official docs. Getting it working in Unity is quite simple:- Click to the left of the line of code you want the break to happen at.
- Attach to Unity.
- Press Play.
- The breakpoints is hit. From there Visual Studio allows to inspect Local values, investigate the Call Stack and use many other Visual Studio debugging tools.
Debug.Break is your friend. It acts as if the pause button was pressed, except it is exactly at the desired line in code. Then the state of the scene can be fully explored. Alternatively use a debug using Debug.LogError while enabling the option to pause on error.
Adjusting the console window
The problem: There are a myriad types of data that may need to be displayed. Not every type fits neatly in the limited space provided by the log entry. The solution: Look into the options of the Console window and select as necessary. Additionally, timestamps can be enabled/disabled.
What did I just build?
The problem: Build completed with a result of 'Succeeded' is not enough information about what has just happened. Especially when looking to slim down the size of the app. The solution: Console window options, then "Open Editor Log". and select as necessary. A text file opens. Starting from section of Build Report there is a detailed breakdown of what assets went in and how much space do they take up, conveniently in descending order.Logging based on preprocessor directives
The problem: There is a system, that is so vital to the whole app that every time it is being interacted with, you have a set of key debug statements that you want to know about. However it is too many to simply comment and uncomment every time. The solution: Creating a static class that is active with a custom directive will call the corresponding log method with custom prefix. To quickly turn that off have another class with exactly the same name and methods that is active with negation of the directive. Then inEdit > Project Settings > Player > Other Settings > Scripting Define Symbols add the symbol that is used to filter this particular logger. The following example assumes naming conventions for a networking module selective logging:
[csharp]
using UnityEngine;
#if NET_LOGGER && (UNITY_EDITOR || DEVELOPMENT_BUILD)
public static class DebugNet {
public static void Log(string message) {
Debug.Log($"[NET] {message}");
}
public static void LogWarning(string message) {
Debug.LogWarning($"[NET] {message}");
}
public static void LogError(string message) {
Debug.LogError($"[NET] {message}");
}
}
#else
public static class DebugNet {
public static void Log(string message) { }
public static void LogWarning(string message) { }
public static void LogError(string message) { }
}
#endif
[/csharp]
To ensure that the logs never end up in the final build, display will also be dependent on the build being a development variant or in the editor. To learn more about directives that Unity provides, have a look in the documentation.
A potential drawback of this solution is that it does leave debug statements in the main code flow (even if you can hide them in a way that minimizes impact on performance). On the other hand, it is like leaving a comment in code of what is expected to have happened at that particular point in time.
Numbers not enough?
The problem: There is a lot of data. This data does not make much sense when viewed as numbers. Maybe it denotes some direction, or area, or it is a number/string, but it's very important to know at a glance its current value and what object it's attached to. The solution: Depending on the needs, there are many approaches to debug by drawing things on the screen.Debug class
The quickest way to draw a line is via the Debug class. From documentation (line, ray):public static void DrawLine(Vector3 start, Vector3 end, Color color = Color.white, float duration = 0.0f, bool depthTest = true); public static void DrawRay(Vector3 start, Vector3 dir, Color color = Color.white, float duration = 0.0f, bool depthTest = true);Those two methods are especially useful in debugging things like raycast. The simple example would be to see how your object sees the world in front of them. This could highlight many possible issues that arise from improper layer setups or wrongly defined raycast source and direction. [csharp] [SerializeField] float hitDist = 1000; void Update() { Ray ray = new Ray(transform.position, transform.forward); RaycastHit hit; if (Physics.Raycast(ray, out hit, hitDist)) { Debug.DrawLine(ray.origin, hit.point, Color.green); //Do your thing on hit } else { Debug.DrawLine(ray.origin, ray.GetPoint(hitDist), Color.red); } } [/csharp] This snippet shows how to visualize your raycast. Do not that if the point is not hit,
DrawLine is used also. This is so that we don't draw a line of infinite length, but the actual distance that is being tested via raycast. The film shows behavior with the aforementioned code:
Gizmos and Handles
If you need more custom shapes to be displayed than simple lines then the Gizmos context is your friend. It can help you draw all sorts of basic shapes, as well as custom meshes. In the following example bounds are being visualized in a similar way a box collider might do it. [csharp] public class BoundingBox : MonoBehaviour { [SerializeField] Bounds bounds; [SerializeField] bool filled; void OnDrawGizmosSelected() { Gizmos.matrix = transform.localToWorldMatrix; if (filled) { Gizmos.DrawCube(bounds.center, bounds.size); } Gizmos.DrawWireCube(bounds.center, bounds.size); } } [/csharp] To ensure the coordinates of the bounds drawn are responsive to the transform component, a matrix that will transform each drawn point from local space to world space is set. There is also a Handles class is generally used to make Editor tools, as it has got mostly methods that return a value if the user modifies something. However, for debugging it has one major advantage that Gizmos doesn't have. It has a handy way to add labels to your objects (documentation).public static void Label(Vector3 position, string text, GUIStyle style);[csharp] void OnDrawGizmos() { Handles.Label(transform.position, $"{gameObject.name} {transform.position.ToString()}", EditorStyles.miniButton); } [/csharp] This snippet demonstrates how to draw a temporary label over the object. It is drawn at the position of the object and displays the object name and position. This can be used to display all kinds of data that you need to know the current state of some variable, and to which object they correspond to with a single glance. As the label is white and thin by default, a style was applied to rectify that. For quick setup that will be visible with any background EditorStyles class was used that houses a button type display.
 Note that Gizmos methods can be called only in functions
 OnDrawGizmos, OnDrawGizmosSelected and those with proper attribute usage. If you try it in any other place, it will not work. This means that Gizmos are specific to Components. If you need to draw things from an Editor window, then Handles are the only option.
In conclusion...
As a final note sometimes to aid with the debug code some third party tools or scripts are needed. One should always be mindful of adding robust plugins, as it may have many functionalities that are simply not needed for the project, and might even hinder it. That being said, now you have hopefully learned some techniques that you might be considering to use when tackling a new bug or aiming to gain a greater understanding of your system. Keep in mind though that a solution should always be tailored to the problem and using a shiny new technique is usually not the way to go. Always take a step back to consider what is actually needed.2 March 2020
0
How NOT to Write Code in React JS
React, Vue, Angular, Ember, Backbone, Polymer, Aurelia, Meteor, Mithril.js, Preact... There are many super fancy Javascript frameworks nowadays. We can write anything we want, it's comfortable, easy to understand, although difficult to master. After few lines of code, even after writing few small applications you may think that no matter what you write, these frameworks will do the job.
 Yeah, what you see above is the iconic series Star Wars and Chewbacca being very skeptical about Han's idea. In the programming universe, you should have this Chewbacca in your mind and this Chewbacca should always be skeptical about your code. It's very important to write your code carefully and thoughtfully no matter what framework you are using. I know it looks that these frameworks do everything for you and you don't have to worry about anything but it's not entirely true. Buckle up, in this article we are going to go through the most common mistakes done in React (and probably other similar frameworks/libraries). I am probably one of the most reliable people to talk about it because I used to make some of these mistakes for a loooong time. And probably I'm still doing some of them.
New feature? Yeah.. One component is enough.
Nope. Nine times out of ten it won't be enough. Imagine that, in your application, you have a list of board games with some simple filtering controls over the table. You know, choosing a price, an age or a type. At the beginning it looks like it's enough to create a BoardGamesList component and put all of the logic inside. You may think that it doesn't have sense to create a separate BoardGameRow and BoardGamesFilters components. Or even PriceFilter, AgeFilter and BoardGameTypeFilter. "It's just a few lines! I don't have time to create all these components with so few lines of code." It's just a few lines for now. But it's very likely that during next year your client will be requiring few more filter options, some fancy icons, 5 ways of ordering the game and 10 ways to display the game row depending on something. Trust me, in my programming life I have experienced too many components which were small at the beginning and after a year it was a massive, uncontrollable piece of sh.. component. Seriously, if you take a few moments and divide it functionally at the beginning, it'll be much easier to work with this component in future. For you. For your colleagues. And even if it stays so small, it'll be easier to find what you need if you rationally divided it into separate React components. Then your work will look like this:- Hey, we have some weird bug while filtering board games by age. Can you do something about it? - Yeah, I know exactly where to find it. It's in PriceFilter.js and it's so small that I will need half an hour to fix it! - Great, I think you should get a pay rise!
 It won't necessarily end this way. But there is a better chance if you properly divide your code into components. And look - I don't even say a word about reusability which is the main reason we use components. But this is a topic for a separate article.
setState? Pff.. I don't have to read the documentation.
If you decided to use React state in your components, you should know that its main function, setState, is asynchronous. What means you can't just put some important code depending on your state just after setState execution. Let's look at this case: [js] this.setState({isItWorking: true}); console.log(this.state.isItWorking); // returns false, WHY?! [/js] Method setState is asynchronous what means it needs few moments to properly set the data you passed. How to handle this problem correctly? The most common way is to pass a callback function as a second parameter which will be executed when the data is passed to the state. [js] this.setState({isItWorking: true}, () => { console.log(this.state.isItWorking); // and now it returns true }); [/js] Sometimes you have to do some consecutive operations on your state. Because of setState asynchrony, you may receive unexpected results. [js] // this.state.name = 'STAR WARS: ' this.setState({name: this.state.name + 'THE RISE OF '}); this.setState({url: this.state.name + 'SKYWALKER'}); [/js] Unfortunately, you won't finish with the real name of episode IX - STAR WARS: THE RISE OF SKYWALKER. Probably you will get partially filled title like STAR WARS: SKYWALKER. It would be a nice title but it's not what we wanted because the second setState has been overwritten by the last one. To fix it you can use one more time the callback technique but there is another way to handle this case. Instead of passing a new object you can pass a function which returns an object. What's the difference? This function's first parameter is the current "version" of state so you will always work on the updated state. [js] // this.state.name = 'STAR WARS: ' this.setState(state => ({name: state.name + 'THE RISE OF '})); this.setState(state => ({name: state.name + 'SKYWALKER'})); [/js] If it's not enough for you and you want to know how setState works internally it'll be a smart choice to read an article from Redux co-author, Dan Abramov: How Does setState Know What to Do?Hey! Why this.props is undefined?
This mistake is still very common, no matter that arrow functions are one of the main features of ES6 specification. [js] handleFieldChange() { console.log(this.props); // return undefined } [/js] Why? I am inside the component, I should have access to my props! Unfortunately not. This function has its own this (different than component's this) and if you want to use the standard function you should consider binding this with .bind(this) or not so beautiful const self = this before the function. Much easier and a simply better option is to use ES6 arrow functions. [js] handleFieldChange = () => { console.log(this.props); // YEAH! It returns my props! } [/js] Arrow function uses something what is called lexical scoping. In a simple way - it uses this from the code containing arrow function - in our case, the component. That's it. No more bindings, no more awful selves, no more unexpectedly missing variables. Arrow functions are also very useful if you need to propagate a few functions. For example, you need a setup function which takes some important parameters and then returns the generic handler function. [js] handleFieldChange = fieldName => value => { this.setState({[fieldName]: value}); // [fieldName] - for your knowledge, it's dynamic key name, it'll take the name you pass in fieldName variable } [/js] This is a very generic way to create a function that receives field name and then returns the generic handler function for, let's say, an input element. And if you execute it like that.. [js] <Input onChange={this.handleFieldChange('description')} />; [/js] ..your input will have this classic function assigned to onChange event: [js] handleFieldChange = value => { this.setState({description: value}); } [/js] You should also know that you can fully omit curly braces if you have something very short to return. [js] getParsedValue = value => parseInt(value, 10); [/js] In my opinion, in most cases you should avoid it because it can be difficult to read it. On the other hand, in simple cases like above, it'll save you a few lines. But you should be careful doing it. Let's say, I have single object to return. I decide to return it in one line because it's a really short line. [js] getSomeObject = value => {id: value}; [/js] Oh yeah, you may think that based on the previous code example it should definitely work. But it's not and it's quite easy to explain. In this case, the system thinks that you use standard arrow function and these curly braces are just the beginning and the end of the function. If you really want to return an object in one line you should use this syntax: [js] getSomeObject = value => ({id: value}); [/js] In this case, the returned object is contained in the brackets and it works like intended. Personally, I don't like using one line functions but it's a very nice way to pass a short code to functions like map or filter. Clean, easy to read and it's included in one line. [js] someCrazyArray.map(element => element.value).filter(value => value.active); [/js] Okaaaaaaay, quite a lot of info about simple arrow functions but I think it's valuable if you didn't know about it. Let's go to the next one of the ReactJS mistakes!The browser has crashed.. Why?
I can't even count how many times I or my buddies were struggling with some weird browser crash or inability to do any action in the application. In many cases, the reason is an infinite loop. I suppose there are billions of ways to get the infinite loop but in React the most common is componentWillReceiveProps or any other React lifecycle method. ComponentWillReceiveProps is currently deprecated but I will focus on this one because there are plenty of React applications still using it and for me most of these bugs happened in this very important lifecycle method. I have multiple examples in my mind which can help visualize the problem but for the purposes of this article I will present this use-case based on the board games example:Every time a user changes the age, the application should load board games for the chosen age.
[js] componentWillReceiveProps(nextProps) { if (nextProps.age) { this.loadBoardGames(nextProps.age); } } [/js] "Right, if there is the age passed, I load board games." If you don't know how this lifecycle works you may end up with the solution similar to above. But this lifecycle method doesn't work exactly like that. First, every time there is some change in component's props, componentWillReceiveProps is executed. It's quite easy to understand. But you may still think: "Okay, so every time the age is changed, it'll load board games. Isn't it okay?". Partially yes, but in most cases there are other props in your component. Props which will also trigger this lifecycle function. Imagine that we have also boardGames prop (where we store currently displayed board games). Let's examine such a situation:- Age prop is changed
- componentWillReceiveProps is executed (what causes board games' load)
- Board games prop is changed
- componentWillReceiveProps is executed (what causes board games' load)
- Board games prop is changed
- componentWillReceiveProps is executed (what causes board games' load)
- INFINITE LOOP!!!
 As you can see, you change age prop only once and board games will be loading forever. Let's change this function a little bit.
[js]
componentWillReceiveProps(nextProps) {
if (this.props.age !== nextProps.age) {
this.loadBoardGames(nextProps.age);
}
}
[/js]
Now we are not simply checking if there is the age but we are checking if there is some change in the age. We check if next "version" of props contains a DIFFERENT age. "Different" is the keyword here. And we are safe, every time boardGames prop (or any other prop) is changed, it won't trigger board games to load because the age prop will still be the same.
Wait.. Are we really safe?
Not necessarily. Most Javascript developers prefer strict comparison (=== or !==) because it's more certain than abstract comparison (==). But it can highlight other minor bugs in your application (what is actually good). Sometimes, some prop can theoretically be the same but of a different format. Let's say our age is represented by years. But there is the possibility that this somehow it will be passed in months. For example, the initial age is fetched from the database and initially we forgot to convert it into the year format. In this case, board games will be loaded two times instead of one. Theoretically, there isn't any serious change in the age but there is a change in the age's format and it's enough to trigger loadBoardGames again. The problem appears more often if the given prop is an object. The object can have 100% the same content but it can still be a different object. Generally, I want to indicate that lifecycle methods are powerful but they should be used very, very carefully. If you need to use it, think what you want to achieve and what is the flow of the prop.
As you can see, you change age prop only once and board games will be loading forever. Let's change this function a little bit.
[js]
componentWillReceiveProps(nextProps) {
if (this.props.age !== nextProps.age) {
this.loadBoardGames(nextProps.age);
}
}
[/js]
Now we are not simply checking if there is the age but we are checking if there is some change in the age. We check if next "version" of props contains a DIFFERENT age. "Different" is the keyword here. And we are safe, every time boardGames prop (or any other prop) is changed, it won't trigger board games to load because the age prop will still be the same.
Wait.. Are we really safe?
Not necessarily. Most Javascript developers prefer strict comparison (=== or !==) because it's more certain than abstract comparison (==). But it can highlight other minor bugs in your application (what is actually good). Sometimes, some prop can theoretically be the same but of a different format. Let's say our age is represented by years. But there is the possibility that this somehow it will be passed in months. For example, the initial age is fetched from the database and initially we forgot to convert it into the year format. In this case, board games will be loaded two times instead of one. Theoretically, there isn't any serious change in the age but there is a change in the age's format and it's enough to trigger loadBoardGames again. The problem appears more often if the given prop is an object. The object can have 100% the same content but it can still be a different object. Generally, I want to indicate that lifecycle methods are powerful but they should be used very, very carefully. If you need to use it, think what you want to achieve and what is the flow of the prop.
Something else?
No, that's it. There are many different ways to crash or mess your React application but I chose these which I experienced myself. I hope it was a valuable reading for you. Now.. let's code!10 December 2019
0
Neo4j with Spring Boot
In this article, I will show you the advantages and disadvantages of the neo4j graph database, the technology that is being used by big companies like Google, Facebook or PayPal. I will also show you how to create and populate it with the help of Spring Boot. Why a graph database…? The main application of graph databases is to store relationship information as a first-class entity, because, despite the name, relational databases do not describe relationships other than the standard many-to-many, one-to-one and one-to-many. A huge advantage of graph databases is that the performance is not reduced with the growth of the amount of data. ...and why neo4j? Apart from the above points, the neo4j itself has a number of advantages, such as:
- scalability
- good documentation
- easy to use
- built-in Spring Boot support
- wide user community
 Now let's open the localhost link in the browser and we should see the remote UI that I was talking about in the advantages of neo4j. Log in with the default credentials (username: “neo4j" and password: “neo4j”) and then set your new password (do not forget it as we will use it later!).
Creating an application
Now we will build the easy demo application that is going to show Formula 1 results, drivers and also will allow us to retrieve drivers that achieved specific race results.
As I mentioned at the beginning, we will use Spring Boot, so we can create our application, for example, by using the https://start.spring.io/ website. For now, we will need only the neo4j dependency. If you, however, do not want to use the Spring Initializr, here is the dependency you will need:
Maven:
[java]
<dependency>
<groupId>org.springframework.boot</groupId>
<artifactId>spring-boot-starter-data-neo4j</artifactId>
</dependency>
[/java]
Gradle:
[java]
compile("org.springframework.boot:spring-boot-starter-data-neo4j")
[/java]
So now for the actual code…
Let’s create a Driver and Race classes
[java]
@NodeEntity
public class Driver {
@Id
@GeneratedValue
private Long id;
private String name;
private Integer number;
public Driver() {
}
public Driver(final String name, final Integer number, final Team team) {
this.name = name;
this.number = number;
this.team = team;
}
/* Getters */
}
[/java]
[java]
@NodeEntity
public class Race {
@Id
@GeneratedValue
private Long id;
private String country;
@Relationship(type = "STARTED_IN", direction = Relationship.INCOMING)
private Result results;
public Race() {
}
public Race(final String country) {
this.country = country;
}
/* Getters */
}
[/java]
We can notice some of the neo4j properties being used in our classes. First of all, they are annotated as @NodeEntity, which obviously means that those classes will represent nodes in our graph. We also need an id that neo4j will use to map our entities (be aware that @Id annotation has to be a neo4j annotation, do not confuse it with JPA @Id!). Next thing we have to be aware of is that the fields are non-final because neo4j needs an empty constructor, which is one of its downsides. Last thing present in the Race class is the @Relationship annotation; as I have mentioned, the main advantage of graph databases is that relationships can have properties. Let’s now create the relationship class:
[java]
@RelationshipEntity(type = "STARTED_IN")
public class Result {
@Id
@GeneratedValue
private Long id;
private Integer place;
@StartNode
private Driver driver;
@EndNode
private Race race;
public Result() {
}
public Result(final Integer place, final Driver driver, final Race race) {
this.place = place;
this.driver = driver;
this.race = race;
}
}
[/java]
When we are creating a relationship class we must annotate it with @RelationshipEntity and pass the type as an argument; it should be the same type as in the node entities. Relationship entities also need an id and constructors. The last crucial thing is the need to specify @StartNode and @EndNode so that neo4j knows how to connect the nodes.
Our next step will be creating a result repository, if you are familiar with Spring repositories you will feel at home as Neo4jRepository extends PagingAndSortingRepository so all the Spring repository methods (eg. findById, deleteById, save,..) are available:
[java]
public interface ResultRepository extends Neo4jRepository<Result, Long> {
List<Result> findAll();
}
[/java]
Alright, so let’s see neo4j in action. For clarity, we will use hard-coded entities in the CommandLineRunner init bean:
[java]
@SpringBootApplication
@EnableNeo4jRepositories
public class F1Application {
public static void main(String[] args) {
SpringApplication.run(F1Application.class, args);
}
@Bean
CommandLineRunner init(ResultRepository resultRepository) {
Race italy = new Race("Italy");
Race singapore = new Race("Singapore");
Driver hamilton = new Driver("Lewis Hamilton",44);
Driver vettel = new Driver("Sebastian Vettel", 5);
return args -> {
resultRepository.save(new Result(1,hamilton,italy));
resultRepository.save(new Result(2,vettel,italy));
resultRepository.save(new Result(4,hamilton,singapore));
resultRepository.save(new Result(3,vettel,singapore));
};
}
[/java]
For everything to work, you need to enable neo4j repositories by annotating the application class with @EnableNeo4jRepositories. The last thing we will need is to set the username and password in application.properties to the values we have chosen when we were setting up our server:
[java]
spring.data.neo4j.username=neo4j
spring.data.neo4j.password=pass
[/java]
If everything went as expected on the remote neo4j interface we should be able to see our populated database:
Now let's open the localhost link in the browser and we should see the remote UI that I was talking about in the advantages of neo4j. Log in with the default credentials (username: “neo4j" and password: “neo4j”) and then set your new password (do not forget it as we will use it later!).
Creating an application
Now we will build the easy demo application that is going to show Formula 1 results, drivers and also will allow us to retrieve drivers that achieved specific race results.
As I mentioned at the beginning, we will use Spring Boot, so we can create our application, for example, by using the https://start.spring.io/ website. For now, we will need only the neo4j dependency. If you, however, do not want to use the Spring Initializr, here is the dependency you will need:
Maven:
[java]
<dependency>
<groupId>org.springframework.boot</groupId>
<artifactId>spring-boot-starter-data-neo4j</artifactId>
</dependency>
[/java]
Gradle:
[java]
compile("org.springframework.boot:spring-boot-starter-data-neo4j")
[/java]
So now for the actual code…
Let’s create a Driver and Race classes
[java]
@NodeEntity
public class Driver {
@Id
@GeneratedValue
private Long id;
private String name;
private Integer number;
public Driver() {
}
public Driver(final String name, final Integer number, final Team team) {
this.name = name;
this.number = number;
this.team = team;
}
/* Getters */
}
[/java]
[java]
@NodeEntity
public class Race {
@Id
@GeneratedValue
private Long id;
private String country;
@Relationship(type = "STARTED_IN", direction = Relationship.INCOMING)
private Result results;
public Race() {
}
public Race(final String country) {
this.country = country;
}
/* Getters */
}
[/java]
We can notice some of the neo4j properties being used in our classes. First of all, they are annotated as @NodeEntity, which obviously means that those classes will represent nodes in our graph. We also need an id that neo4j will use to map our entities (be aware that @Id annotation has to be a neo4j annotation, do not confuse it with JPA @Id!). Next thing we have to be aware of is that the fields are non-final because neo4j needs an empty constructor, which is one of its downsides. Last thing present in the Race class is the @Relationship annotation; as I have mentioned, the main advantage of graph databases is that relationships can have properties. Let’s now create the relationship class:
[java]
@RelationshipEntity(type = "STARTED_IN")
public class Result {
@Id
@GeneratedValue
private Long id;
private Integer place;
@StartNode
private Driver driver;
@EndNode
private Race race;
public Result() {
}
public Result(final Integer place, final Driver driver, final Race race) {
this.place = place;
this.driver = driver;
this.race = race;
}
}
[/java]
When we are creating a relationship class we must annotate it with @RelationshipEntity and pass the type as an argument; it should be the same type as in the node entities. Relationship entities also need an id and constructors. The last crucial thing is the need to specify @StartNode and @EndNode so that neo4j knows how to connect the nodes.
Our next step will be creating a result repository, if you are familiar with Spring repositories you will feel at home as Neo4jRepository extends PagingAndSortingRepository so all the Spring repository methods (eg. findById, deleteById, save,..) are available:
[java]
public interface ResultRepository extends Neo4jRepository<Result, Long> {
List<Result> findAll();
}
[/java]
Alright, so let’s see neo4j in action. For clarity, we will use hard-coded entities in the CommandLineRunner init bean:
[java]
@SpringBootApplication
@EnableNeo4jRepositories
public class F1Application {
public static void main(String[] args) {
SpringApplication.run(F1Application.class, args);
}
@Bean
CommandLineRunner init(ResultRepository resultRepository) {
Race italy = new Race("Italy");
Race singapore = new Race("Singapore");
Driver hamilton = new Driver("Lewis Hamilton",44);
Driver vettel = new Driver("Sebastian Vettel", 5);
return args -> {
resultRepository.save(new Result(1,hamilton,italy));
resultRepository.save(new Result(2,vettel,italy));
resultRepository.save(new Result(4,hamilton,singapore));
resultRepository.save(new Result(3,vettel,singapore));
};
}
[/java]
For everything to work, you need to enable neo4j repositories by annotating the application class with @EnableNeo4jRepositories. The last thing we will need is to set the username and password in application.properties to the values we have chosen when we were setting up our server:
[java]
spring.data.neo4j.username=neo4j
spring.data.neo4j.password=pass
[/java]
If everything went as expected on the remote neo4j interface we should be able to see our populated database:
 When we hover over the STARTED_IN relation we will see the places that we have set in the init method.
Custom query and integration testing
Neo4j uses the CYPHER query language and with its use, we can create our own custom query methods, so let's say we want to create a list of drivers that achieved a specific result that is interesting for us. For that in our ResultRepository we will create the getByResult(Integer result) method:
[java]
@Query("MATCH (r:Race)<-[s:STARTED_IN]-(driver: Driver) WHERE (s.place)={result} RETURN driver")
List<Driver> getByResult(@Param("result") Integer result);
[/java]
We have created something by ourselves, so it would be nice to test it. Let's add JUnit, neo4j, neo4j ogm test and graphaware dependencies:
Maven:
[java]
<dependency>
<groupId>org.neo4j</groupId>
<artifactId>neo4j</artifactId>
<version>3.4.8</version>
</dependency>
<dependency>
<groupId>org.neo4j</groupId>
<artifactId>neo4j-ogm-test</artifactId>
<version>3.1.3</version>
<scope>test</scope>
</dependency>
<dependency>
<groupId>com.graphaware.neo4j</groupId>
<artifactId>resttest</artifactId>
<version>3.4.8.52.18</version>
</dependency>
<dependency>
<groupId>junit</groupId>
<artifactId>junit</artifactId>
<version>4.12</version>
<scope>test</scope>
</dependency>
[/java]
Gradle:
[java]
compile group: 'org.neo4j', name: 'neo4j', version: '3.4.8'
testCompile group: 'org.neo4j', name: 'neo4j-ogm-test', version: '3.1.3'
testCompile group: 'com.graphaware.neo4j', name: 'tests', version: '3.4.8.52'
testCompile group: 'junit', name: 'junit', version: '4.12'
[/java]
Our next step will be to create the context. For that let’s create the PersistenceContext class in our test directory:
[java]
@Configuration
@EnableNeo4jRepositories("com.neo4j.f1.repositories")
@EnableTransactionManagement
@ComponentScan("com.neo4j.f1")
public class PersistenceContext {
@Bean
public org.neo4j.ogm.config.Configuration configuration() {
org.neo4j.ogm.config.Configuration.Builder builder = new org.neo4j.ogm.config.Configuration.Builder();
return builder.build();
}
@Bean
public SessionFactory sessionFactory() {
return new SessionFactory(configuration(), "com.neo4j.f1.domain");
}
@Bean
public PlatformTransactionManager transactionManager() {
return new Neo4jTransactionManager(sessionFactory());
}
}
[/java]
Make sure to provide the valid packages directories where needed!!!
Let’s now create a test class and the actual tests:
[java]
@ContextConfiguration(classes = {PersistenceContext.class})
@RunWith(SpringRunner.class)
public class ResultTests {
@Autowired
ResultRepository resultRepository;
@Before
public void setup() {
Race italy = new Race("Italy");
Race singapore = new Race("Singapore");
Driver hamilton = new Driver("Lewis Hamilton", 44);
Driver vettel = new Driver("Sebastian Vettel", 5);
Driver alonso = new Driver("Fernando Alonso", 14);
resultRepository.save(new Result(1, hamilton, italy));
resultRepository.save(new Result(2, vettel, italy));
resultRepository.save(new Result(13,alonso,italy));
resultRepository.save(new Result(4, hamilton, singapore));
resultRepository.save(new Result(1, vettel, singapore));
resultRepository.save(new Result(12,alonso,singapore));
}
@Test
public void checkIfAllAreSaved() {
List<Result> results = resultRepository.findAll();
Assert.assertEquals(6,results.size());
}
@Test
public void checkIfCustomQueryHasRightSize() {
List<Driver> winners = resultRepository.getByResult(1);
Assert.assertEquals(2,winners.size());
}
@After
public void cleanUp() {
resultRepository.deleteAll();
}
}
[/java]
Conclusions
I hope I have shown how nice and easy is to use neo4j. If you would like to broaden your knowledge, more tutorials you can find at https://neo4j.com/docs/developer-manual/3.4/
When we hover over the STARTED_IN relation we will see the places that we have set in the init method.
Custom query and integration testing
Neo4j uses the CYPHER query language and with its use, we can create our own custom query methods, so let's say we want to create a list of drivers that achieved a specific result that is interesting for us. For that in our ResultRepository we will create the getByResult(Integer result) method:
[java]
@Query("MATCH (r:Race)<-[s:STARTED_IN]-(driver: Driver) WHERE (s.place)={result} RETURN driver")
List<Driver> getByResult(@Param("result") Integer result);
[/java]
We have created something by ourselves, so it would be nice to test it. Let's add JUnit, neo4j, neo4j ogm test and graphaware dependencies:
Maven:
[java]
<dependency>
<groupId>org.neo4j</groupId>
<artifactId>neo4j</artifactId>
<version>3.4.8</version>
</dependency>
<dependency>
<groupId>org.neo4j</groupId>
<artifactId>neo4j-ogm-test</artifactId>
<version>3.1.3</version>
<scope>test</scope>
</dependency>
<dependency>
<groupId>com.graphaware.neo4j</groupId>
<artifactId>resttest</artifactId>
<version>3.4.8.52.18</version>
</dependency>
<dependency>
<groupId>junit</groupId>
<artifactId>junit</artifactId>
<version>4.12</version>
<scope>test</scope>
</dependency>
[/java]
Gradle:
[java]
compile group: 'org.neo4j', name: 'neo4j', version: '3.4.8'
testCompile group: 'org.neo4j', name: 'neo4j-ogm-test', version: '3.1.3'
testCompile group: 'com.graphaware.neo4j', name: 'tests', version: '3.4.8.52'
testCompile group: 'junit', name: 'junit', version: '4.12'
[/java]
Our next step will be to create the context. For that let’s create the PersistenceContext class in our test directory:
[java]
@Configuration
@EnableNeo4jRepositories("com.neo4j.f1.repositories")
@EnableTransactionManagement
@ComponentScan("com.neo4j.f1")
public class PersistenceContext {
@Bean
public org.neo4j.ogm.config.Configuration configuration() {
org.neo4j.ogm.config.Configuration.Builder builder = new org.neo4j.ogm.config.Configuration.Builder();
return builder.build();
}
@Bean
public SessionFactory sessionFactory() {
return new SessionFactory(configuration(), "com.neo4j.f1.domain");
}
@Bean
public PlatformTransactionManager transactionManager() {
return new Neo4jTransactionManager(sessionFactory());
}
}
[/java]
Make sure to provide the valid packages directories where needed!!!
Let’s now create a test class and the actual tests:
[java]
@ContextConfiguration(classes = {PersistenceContext.class})
@RunWith(SpringRunner.class)
public class ResultTests {
@Autowired
ResultRepository resultRepository;
@Before
public void setup() {
Race italy = new Race("Italy");
Race singapore = new Race("Singapore");
Driver hamilton = new Driver("Lewis Hamilton", 44);
Driver vettel = new Driver("Sebastian Vettel", 5);
Driver alonso = new Driver("Fernando Alonso", 14);
resultRepository.save(new Result(1, hamilton, italy));
resultRepository.save(new Result(2, vettel, italy));
resultRepository.save(new Result(13,alonso,italy));
resultRepository.save(new Result(4, hamilton, singapore));
resultRepository.save(new Result(1, vettel, singapore));
resultRepository.save(new Result(12,alonso,singapore));
}
@Test
public void checkIfAllAreSaved() {
List<Result> results = resultRepository.findAll();
Assert.assertEquals(6,results.size());
}
@Test
public void checkIfCustomQueryHasRightSize() {
List<Driver> winners = resultRepository.getByResult(1);
Assert.assertEquals(2,winners.size());
}
@After
public void cleanUp() {
resultRepository.deleteAll();
}
}
[/java]
Conclusions
I hope I have shown how nice and easy is to use neo4j. If you would like to broaden your knowledge, more tutorials you can find at https://neo4j.com/docs/developer-manual/3.4/
10 June 2019
1
6 Tips That Every MySQL User Should Know
Over the last 3 years, I have been working with MySQL almost every day. Even though non-relational databases like MongoDB are gaining more and more popularity every year, traditional SQL solutions are still widely used for many purposes. In this post, I will share some of my tricks I have been using to make my life easier. Note: most of those tips apply only to development machines, for production you should take more care.
1. Run MySQL in Docker
Seriously, in 2018 there is absolutely no need to run MySQL server natively by installing it, setting users and passwords, performing upgrades etc. You are wasting your client's time if you are still doing it. Just use the sample Docker Compose file as a working starting point: [code] version: '3' services: mysql: image: mysql:5.7 environment: - MYSQL_ROOT_PASSWORD=root - MYSQL_DATABASE=myproject ports: - 127.0.0.1:3306:3306 volumes: - ./varlibmysql:/var/lib/mysql [/code] After docker-compose up, you will have a working server with localhost-only port bound on standard port 3306, one user root/root and a pre-created "myproject" database. Throw in restart: always into Compose file if you want to keep the server running across reboots. That is enough for 95% of software projects, this solution is completely disposable and easy to recreate. Note: I still have MySQL client installed natively on my development machine. Technically speaking, there is a way of avoiding this too and running the client itself from Docker image, but that is a matter of preference.2. Store MySQL data in RAM
In Docker world, the best practice for handling data storage is to store it outside of the container filesystem - in case of a development machine, in some mounted directory on the host. A cool trick, at least on Linux, is to create a RAM-based filesystem called tmpfs and use it as data storage for MySQL. This will, of course, result in data loss after machine restart, but who cares about development data? If it is important, you should have a recent and verified backup anyway, right? In my case, I am mounting a folder /tmp/varlibmysql into container /var/lib/mysql, since I am using ramdisk for the whole temporary directory to limit SSD wearing. So the relevant part of Compose file is: [code] ... volumes: - /tmp/myproject/varlibmysql:/var/lib/mysql ... [/code] There is a noticeable performance gain with this configuration: I measured the time it takes to run a few hundred Liquibase migrations on application startup and the time it takes to import ~1GB database dump.- migrations: SSD 0:44, ramdisk 0:07 - huge speedup
- import: SSD 5:23, ramdisk 4:14 - small but noticeable speedup
3. Manage database dumps like a boss
I personally dislike edge case bugs, which often appear in web applications. One of the ways for a tester to describe such rarely occurring bug is to provide a list of bazillion intricate steps, that have to be carefully performed in order for the bug to appear. It is much easier to create a bug report with a database dump attached, which contains the whole state of the application. As a result, explaining and more importantly reproducing a bug is much easier and faster. However, if every time this happens there is a need to go to StackOverflow to recall mysqldump syntax, no one will want to do this. So let's fix the issue once and for all: [code] $ cat export.sh #! /bin/bash set -e DATABASE=myproject if [ "$#" -ne 1 ]; then echo "Usage: export.sh <filename.sql.bz2>" exit 1 fi echo "Exporting to $1..." mysqldump --protocol tcp -h localhost -u root -proot ${DATABASE} \ | pv \ | bzip2 > "$1" echo "Export finished." [/code] [code] $ cat import.sh #! /bin/bash set -e DATABASE=myproject if [ "$#" -ne 1 ]; then echo "Usage: import.sh <filename.sql.bz2>" exit 1 fi echo "Importing from $1..." bzcat "$1" \ | pv \ | mysql --protocol tcp -h localhost -u root -proot ${DATABASE} echo "Importing finished." [/code] [code] $ cat drop.sh #! /bin/bash set -e DATABASE=myproject echo "Dropping and recreating ${DATABASE} ..." mysql --protocol tcp -h localhost -u root -proot ${DATABASE} \ -e "drop database ${DATABASE}; create database ${DATABASE};" echo "Done." [/code] These are 3 scripts I use every day for SQL export, import and one extra for recreating a database for testing purposes. Those scripts use bzip2 compression for minimum file size and pv tool for visualising data flow.4. Log executed queries
Recently I have been fixing some performance problems in one of our projects. Our business contact reported that "this specific webpage is slow when there are lots of users present". I started looking around in Chrome Developer Tools and it became clear that the issue is on the backend side, as usual... I could not see any obvious bottlenecks in Java code, so I went a layer down into the database and yep, there was a performance problem there - some innocent SQL query was executed thousands of times for no reason. In order to debug such cases, query logging is a must, otherwise we are shooting in the dark. You can enable basic query logging using those commands in MySQL console: [code] MySQL [myproject]> SET global general_log = 1; Query OK, 0 rows affected (0.00 sec) MySQL [myproject]> SET global log_output = 'table'; Query OK, 0 rows affected (0.00 sec) [/code] From now on, all queries will be logged in special table mysql.general_log. Fun fact - this table is actually a real physical table, it can be searched, exported etc. - good for documenting bugfixes. Let's create some sample database structure: [code] MySQL [myproject]> create table random_numbers(number float); Query OK, 0 rows affected (0.00 sec) MySQL [myproject]> insert into random_numbers values (rand()), (rand()), (rand()), (rand()); Query OK, 4 rows affected (0.00 sec) Records: 4 Duplicates: 0 Warnings: 0 [/code] And now run a few queries and see if they are captured in the log: [code] MySQL [myproject]> select * from random_numbers where number < 0.1; Empty set (0.00 sec) MySQL [myproject]> select * from random_numbers where number < 0.5; +----------+ | number | +----------+ | 0.254259 | +----------+ 1 row in set (0.00 sec) MySQL [myproject]> select * from random_numbers where number < 0.9; +----------+ | number | +----------+ | 0.777688 | | 0.254259 | +----------+ 2 rows in set (0.00 sec) MySQL [myproject]> select event_time, argument from mysql.general_log; +----------------------------+-------------------------------------------------+ | event_time | argument | +----------------------------+-------------------------------------------------+ | 2018-11-26 12:42:19.784295 | select * from random_numbers where number < 0.1 | | 2018-11-26 12:42:22.400308 | select * from random_numbers where number < 0.5 | | 2018-11-26 12:42:24.184330 | select * from random_numbers where number < 0.9 | | 2018-11-26 12:42:28.768540 | select * from mysql.general_log | +----------------------------+-------------------------------------------------+ 4 rows in set (0.00 sec) [/code] Perfect! Keep in mind that "all queries" means all of all, so if you are using graphical database tools for viewing query logs, those "query querying logs" will be also there.5. Use remote servers
MySQL protocol runs over TCP/IP (note to nitpickers: yes, it can also work through UNIX sockets, but the principle is the same). It is perfectly fine to use some remote MySQL server/service for local development instead of a local server. This is useful for working with big databases that would not fit onto tiny laptop SSD, or if we need more performance. The only concern is network latency, which can sometimes diminish any performance gains - but I think it is still a useful trick. Let's try Amazon RDS. It is pretty expensive for long-term usage but affordable for one-off tasks. Graphical setup wizard in AWS web console is pretty easy to use so I will not cover it here in full, however, keep attention on:- DB instance class - pick the cheapest one for start, you can always upgrade it later if needed
- Allocated storage - the minimum (20 GiB) is actually a huge amount of space for a typical project, but you can increase it now if you need
- Username and password - pick something secure, because our instance will be publicly visible from the Internet
- Security group - pick/create a security group with full access from the Internet
 We can look up its details:
 And finally, find the server hostname to connect to...
 ...like usual:
[code]
$ mysql -uroot -pmysqlletmein --protocol tcp \
-h mydbinstance.cizrsk4vjj5m.eu-central-1.rds.amazonaws.com
Welcome to the MariaDB monitor. Commands end with ; or \g.
Your MySQL connection id is 15
Server version: 5.6.41-log Source distribution
Copyright (c) 2000, 2018, Oracle, MariaDB Corporation Ab and others.
Type 'help;' or '\h' for help. Type '\c' to clear the current input statement.
MySQL [(none)]> select rand();
+--------------------+
| rand() |
+--------------------+
| 0.8418013517202823 |
+--------------------+
1 row in set (0.06 sec)
[/code]
Now we can configure our backend to use it and it should work exactly like a local server. Amazon RDS gives us some useful development features like real-time monitoring, automatic backups, spinning new database instances from snapshots and much more. Go try it!
...like usual:
[code]
$ mysql -uroot -pmysqlletmein --protocol tcp \
-h mydbinstance.cizrsk4vjj5m.eu-central-1.rds.amazonaws.com
Welcome to the MariaDB monitor. Commands end with ; or \g.
Your MySQL connection id is 15
Server version: 5.6.41-log Source distribution
Copyright (c) 2000, 2018, Oracle, MariaDB Corporation Ab and others.
Type 'help;' or '\h' for help. Type '\c' to clear the current input statement.
MySQL [(none)]> select rand();
+--------------------+
| rand() |
+--------------------+
| 0.8418013517202823 |
+--------------------+
1 row in set (0.06 sec)
[/code]
Now we can configure our backend to use it and it should work exactly like a local server. Amazon RDS gives us some useful development features like real-time monitoring, automatic backups, spinning new database instances from snapshots and much more. Go try it!
6. Learn some SQL!
Finally, even if you love ORMs and you can't live without Spring Data and sexy dynamic finders (which can sometimes be long enough to wrap on 4k screen), it is very beneficial to learn at least some SQL to understand how everything works underneath, how ORMs are mapping one-to-many and many-to-many relationships with the use of extra join tables, how transactions work (very important in high load systems) and so on. Also, some kinds of performance problems ("N+1 select" being the most common) are completely undiscoverable without knowing how underlying SQL is generated and subsequently executed. And that is all. Thanks for reaching this point and I hope you've learnt something.15 April 2019
0

Let’s shake some trees – how to enhance the performance of your application
Nowadays JavaScript applications are getting bigger and bigger. One of the most crucial things while developing is to optimise the page load time by reducing the size of the JavaScript bundle file.
JavaScript is an expensive resource when processing and should be compressed when it is about to be sent over the network.
One of the most popular techniques to improve the performance of our applications is code splitting. It is based on splitting the application into chunks and serving only those parts of JavaScript code that are needed at the specified time. However, this article is going to be about another good practice called tree shaking.
Tree shaking is used within the ES2015 import and export syntax and supports the dead-code elimination. Since Webpack 4 released it is possible to provide the hint for a compiler by the “sideEffects” property to point the modules that can be safely pruned from the application tree if unused. Function may be supposed to have side effects if it modifies something outside its own scope.
Real life example
In order to introduce tree shaking concept more precisely, let’s start with creating a new project including the application entry point (index.js) and the output bundle file (main.js).
In the next step, a new JavaScript file (utils.js) is added to the src directory...
[code]
export function foo() {
console.log('First testing function')
}
export function bar() {
console.log('Second testing function')
}
[/code]
...and imported in the index.js.
[code]
import { foo } from './utils.js'
foo()
[/code]
Webpack 4 introduces the production and development mode. In order to get a not minified output bundle, we are supposed to run a build process in the development mode what can be defined in the package.json file.
[code]
"scripts": {
"dev": "webpack --mode development",
"build": "webpack --mode production"
}
[/code]
Now, just get the terminal and run: npm run build script.
Despite, only the foo function has been required in the entry point, our output bundle still consists of both foo and bar methods. Bar function is known as a “dead code” since it is unused export that should be dropped.
[code]
console.log('First testing function');\n\nfunction bar() {\n console.log('Second testing function')
[/code]
To fix this problem we are about to set the “sideEffects” property in package.json file.
[code]
{
"name": "tree-shaking",
"version": "1.0.0",
"sideEffects": "false",
}
[/code]
That property just tells the compiler that there are not any side effects files and every unused code can be pruned. It accepts also absolute and relative paths to the files that should not be dropped due having some side effects.
[code]
{
"name": "tree-shaking",
"version": "1.0.0",
"sideEffects": "./src/file-wth-side-effects.js",
}
[/code]
Minification
After we pruned unused ES6 imports and exports, we still need to remove “dead code” from the application bundle. The only thing we have to do is to set the mode configuration to production and execute npm run build.
[code]
([function(e,t,n){"use strict";n.r(t),console.log("First testing function")}]);
[/code]
As we can see, the second testing function is no more included in the bundle minified file.
Use three shaking with the ES6
It is crucial to keep in mind that tree shaking pattern can be used only within the ES6 import and export modules. We cannot “shake the tree” while using the CommonJS without the help of special plugins. To solve this issue, setting the babel-preset-env to leave the ES6 modules on their own should be performed.
[code]
{
"presets": [
["env", {
"modules": false
}]
]
}
[/code]
Exception
Removing unused modules does not work while dealing with lodash. Lodash is one of the most popular utility library. If you import a module in the way it is depicted below, it will still pull all the lodash library.
[code]
import { join } from 'lodash'
[/code]
To go around that, we need to install lodash-es package and require the modules in the following way:
[code]
import join from 'lodash-es/join'
[/code]
Conclusion
Let’s prove the statement from the beginning of this article! Let’s take a closer look at the sizes of the bundle file (main.js) before and after the tree shaking and minification process.

 As we can see we minimized the output size significantly. When you start using tree shaking in your projects it may seem not taking a big advantage of application performance at all. You will notice how it really boosts up your work while having a more complex application tree.
14 January 2019
0
0